
Problem tree analysis
Write the central problem on the trunk, put causes below and consequences above, and check every link you draw before you trust it.
- Time
- 45 min
- People
- 3–6
- Kind of work
- Frame

In short
A problem tree is a diagram that places one central problem on the trunk, its causes as roots below and its consequences as branches above. The team builds it from evidence, then checks each link. Three to six people can draft one in about 45 minutes and use it to agree which causes to work on and why it matters.
What it is
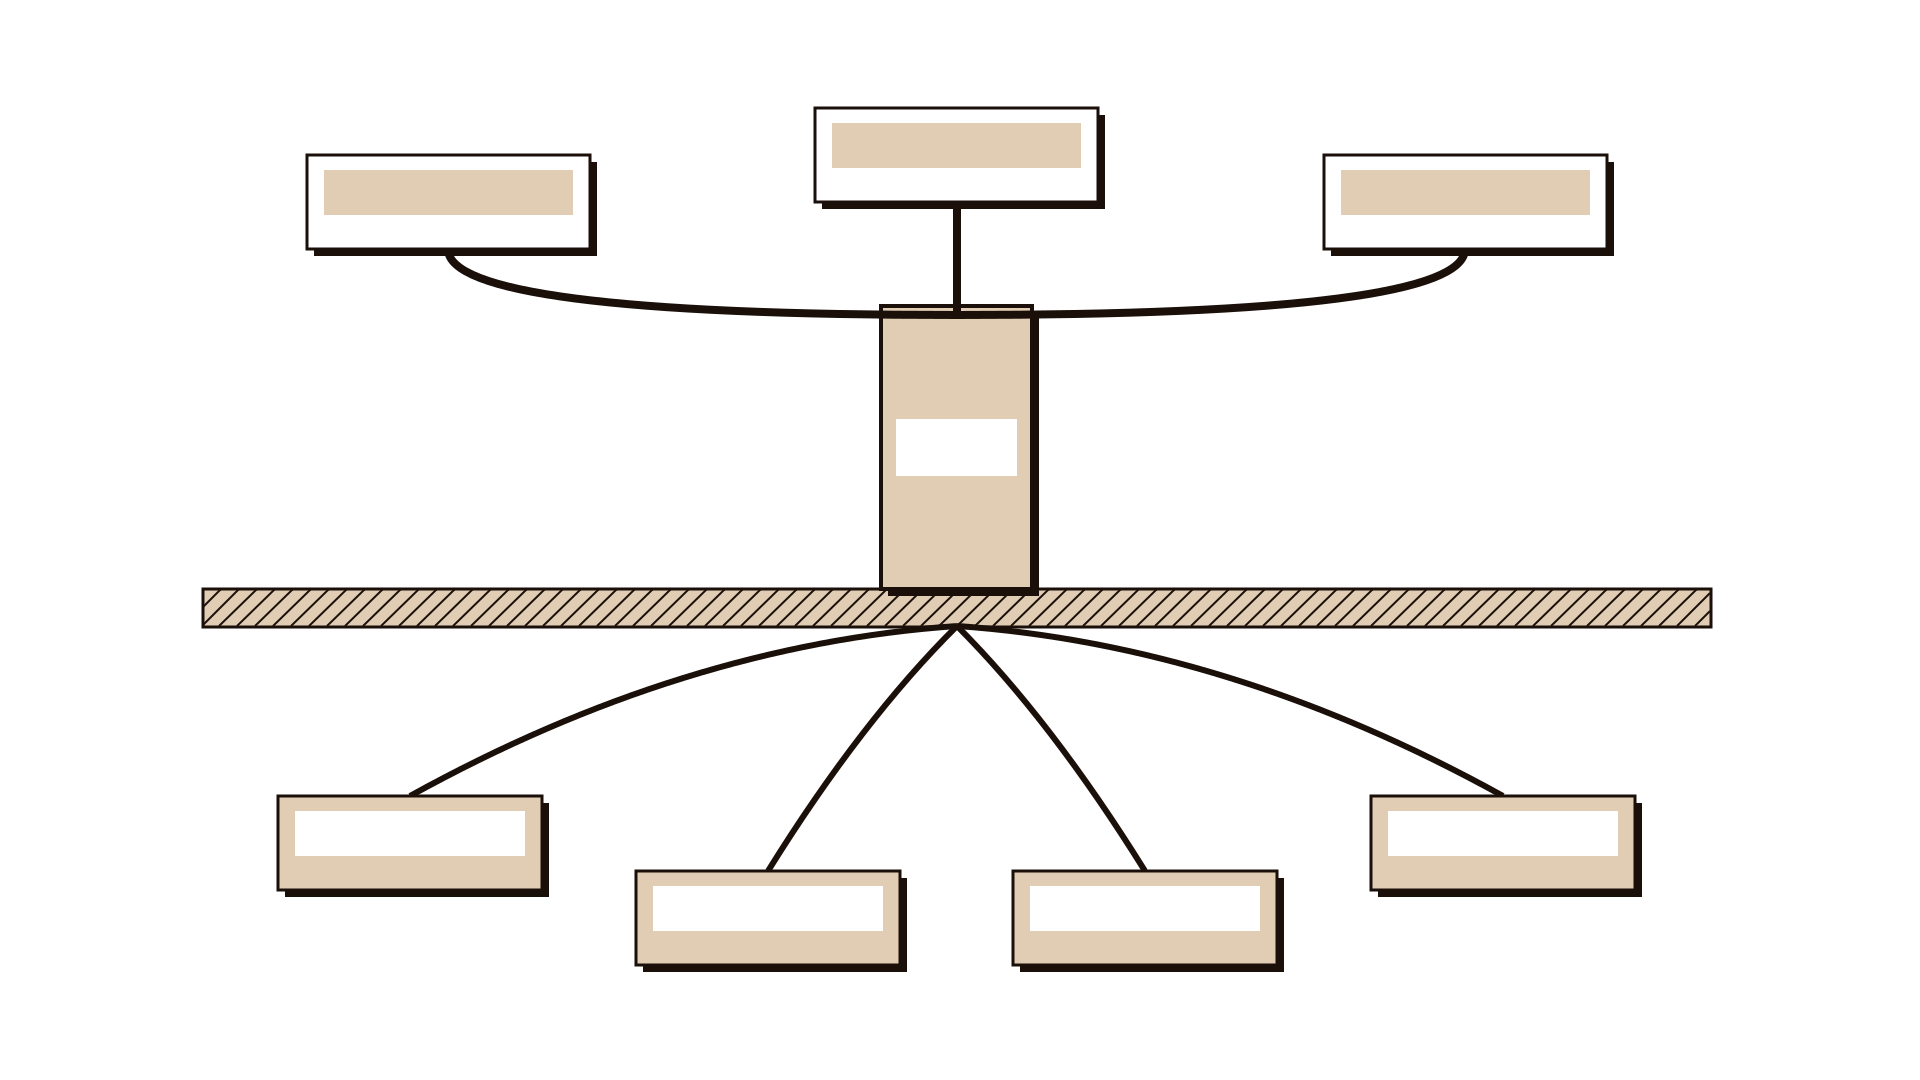
A problem tree is a picture of one problem in its setting. The central problem goes on the trunk. Below it, as roots, go the causes: the conditions that produce the problem. Above it, as branches, go the consequences: what happens because the problem exists. The shape makes one thing very clear. You fix a problem by working on its roots, and you justify the effort by pointing to its branches.
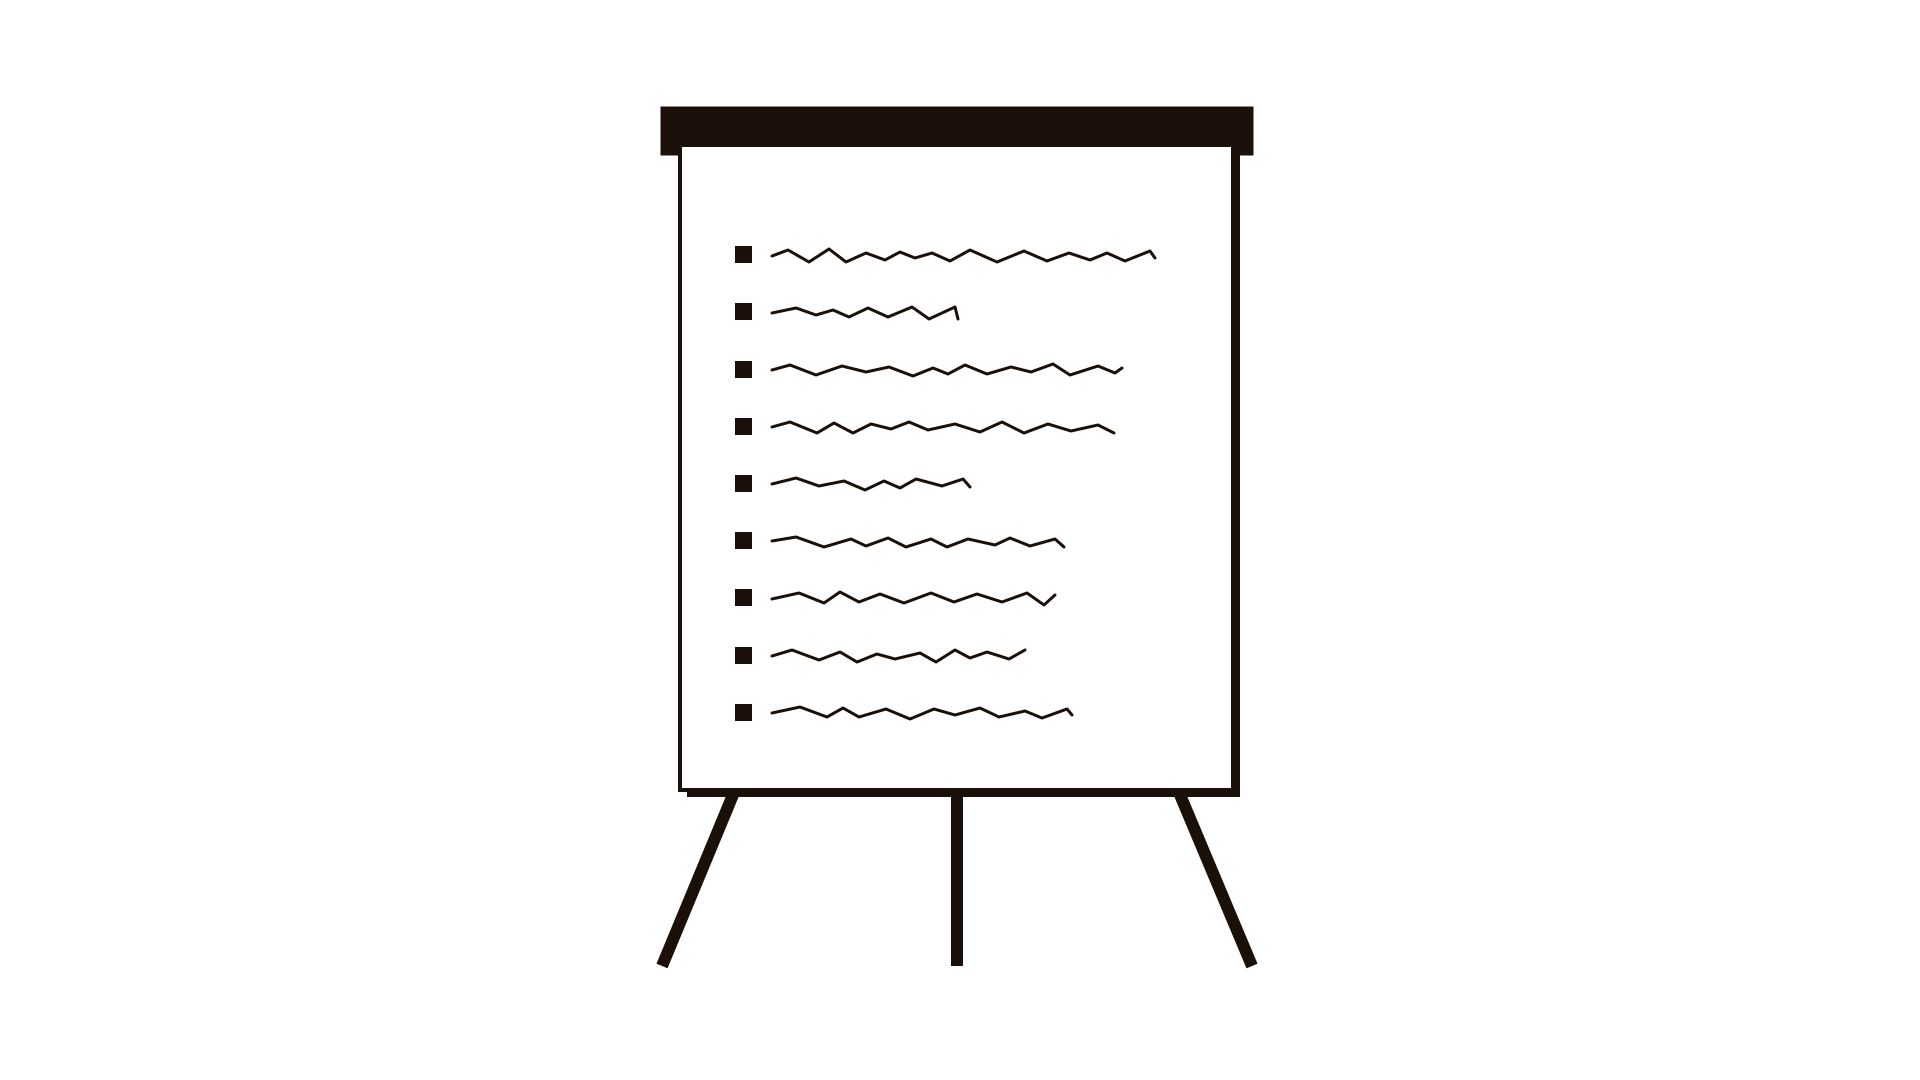
Problem trees are widely used in public policy and development planning, where teams need to agree on a problem before they agree on a programme. In an organisation they help untangle a common confusion. Lists of problems on a flip chart usually mix causes, symptoms and effects in one column. Sorting them into roots and branches shows which items you can act on, which ones you will measure, and which links between them you have only assumed.
When to use it
Use it when
- When a flip chart of problems mixes causes and effects and the team cannot agree what to fix.
- When you need to explain to decision makers why a problem matters, not just what it is.
- After affinity grouping, to arrange the patterns into causes and consequences.
- When planning a project, so its objectives aim at causes and its measures track consequences.
- When different teams each believe their own issue is the central problem.
Skip it when
- When you have no evidence yet. A tree built from opinion looks logical and can mislead.
- When you only need the cause of one narrow failure. Five whys is faster.
- When the problem is really several separate problems. Draw one tree for each.
You need
- Time
- About 45 minutes for a first tree, plus time to check the weakest links.
- People
- Three to six people who know the problem, including someone affected by its consequences.
- Materials
- A large sheet or wall, sticky notes in two colours (causes and consequences), markers, the four-field worksheet and any research findings.
How to run it
Step 1: Write the central problem
Agree one sentence for the trunk that describes the problem as a condition, not as a missing solution: staff leave requests take an average of 19 days to approve. Avoid wording such as no workflow system, which assumes the answer.
Step 2: Gather the candidate items
Put up everything the team already knows: research patterns, complaints, data points. If you have a flip chart of mixed issues, copy each item onto its own note.
Step 3: Sort causes from consequences
For each note, ask: does this make the problem happen, or does it happen because of the problem? Causes go below the trunk, consequences above. If the team cannot decide, put the note to one side and come back to it.
Step 4: Build the layers
Arrange the roots in layers: direct causes just under the trunk, deeper causes beneath them. Do the same for branches: immediate consequences first, wider effects above. Draw a line for each link.
Step 5: Check every link
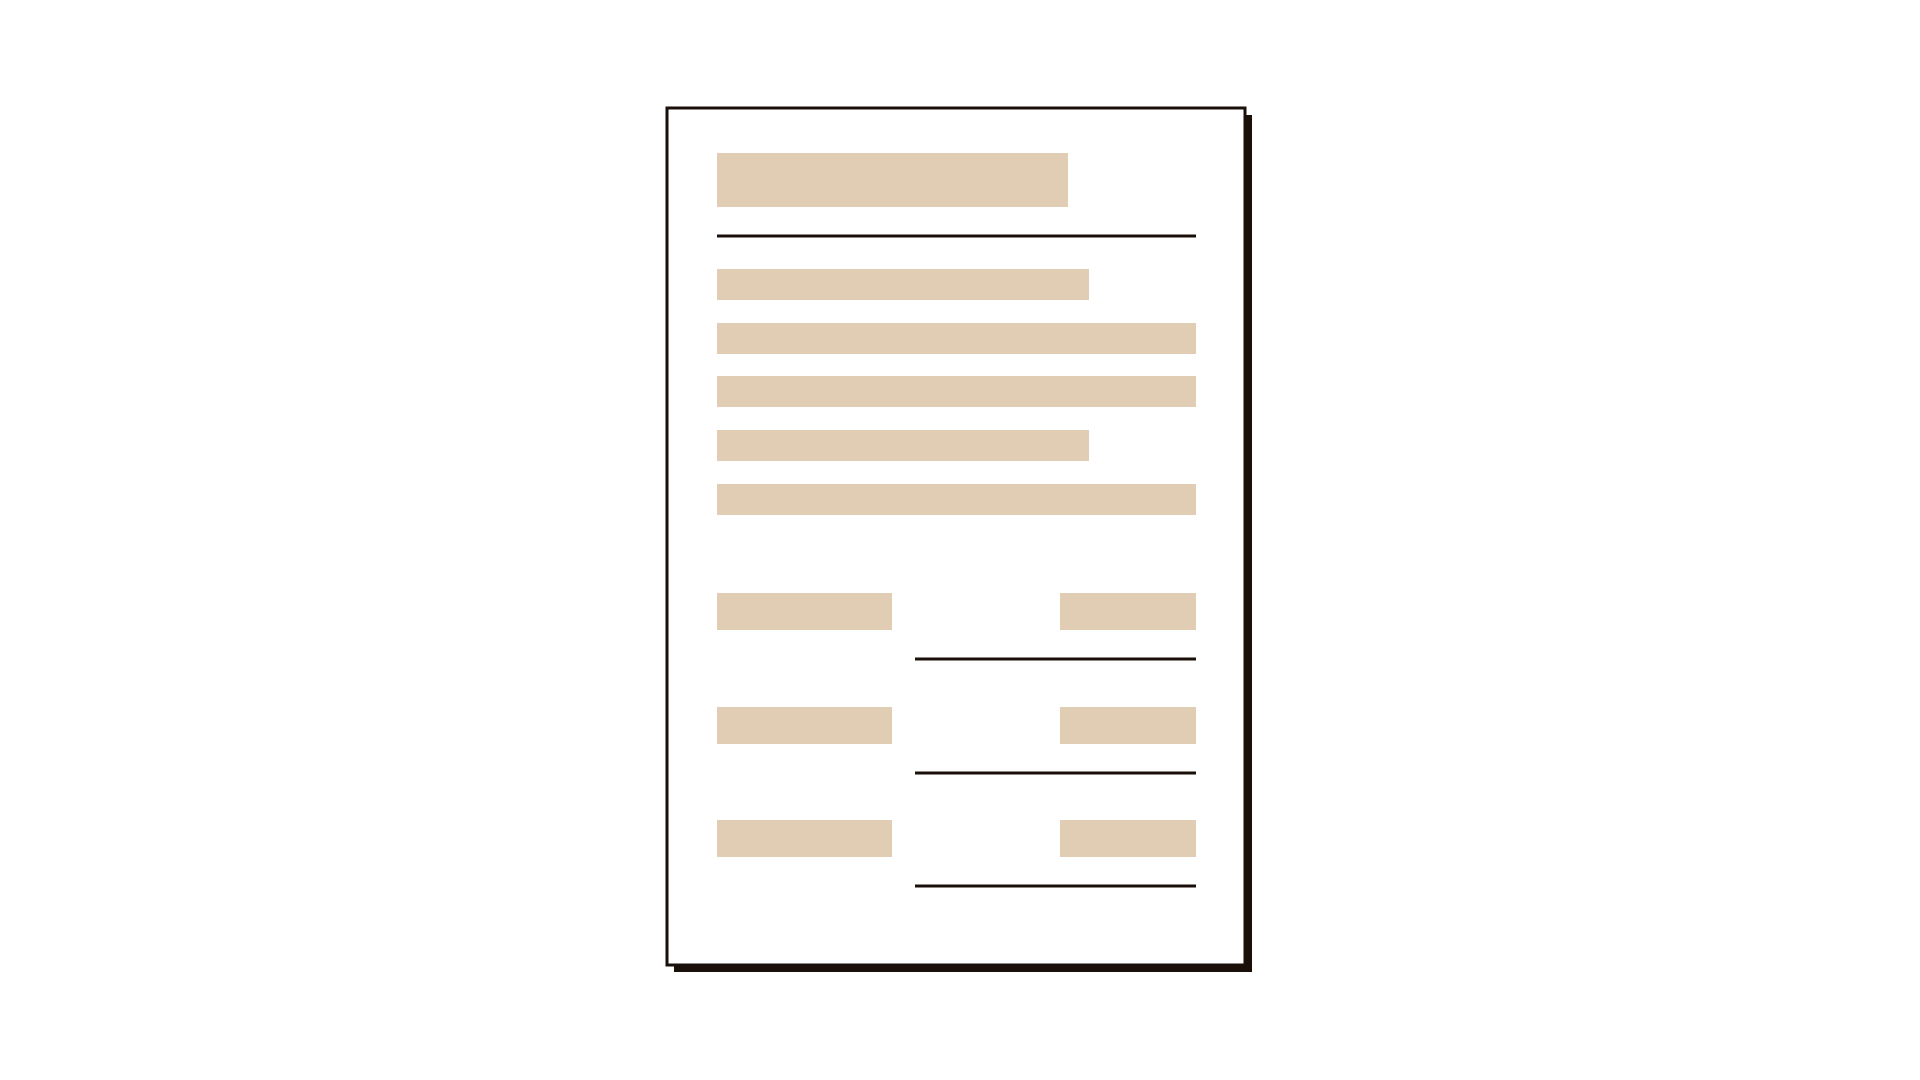
Read each line aloud as because or so: because requests need three signatures, approval takes 19 days. For every link, write the Evidence in the worksheet. Where there is none, draw the line dotted and mark it to check.
Step 6: Choose the roots to work on
Pick the two or three causes that are well supported, within your reach and likely to shift the problem most. These become the focus of your next work.
Step 7: Choose the branches to watch
Pick one or two consequences you can measure, such as last-minute leave cancellations. These tell you later whether working on the roots made a difference.
Worked example
An insurance company's HR team hears constant complaints about leave approval. Their flip chart from a staff meeting lists twelve issues in one column, from slow managers to missed family events. Five people meet to build a problem tree.
The team agrees the trunk: staff leave requests take an average of 19 days to approve. They check the figure against a sample of recent leave requests with dated signatures, so the trunk itself rests on evidence.
They copy the twelve flip chart items onto notes and sort them. Requests need three signatures goes below the trunk as a cause. Staff cancel family travel goes above as a consequence. Managers are slow is reworded as approvers are often away and has no delegate, which the team can observe.
Checking links, they find solid evidence for the three-signature rule and the absent-approver gap in the request sample. A proposed link from the HR system is old to the delay has no evidence behind it, so they draw it dotted and mark it to check.
The team chooses two roots to work on: the number of signatures and the lack of delegates. They choose one branch to watch: last-minute cancellations of approved travel. The tree goes into the project brief, with the dotted link flagged for testing.
IllustrativeTips and mistakes
Tips
- Keep the trunk to one problem. If two problems keep competing for it, draw two trees.
- Use two note colours so causes and consequences are obvious from across the room.
- Reword blaming items into observable conditions before placing them.
- Bring in someone who lives with the consequences. They often see branches the team forgets.
- Photograph the tree and keep the dotted links on a visible list of things to check.
Common mistakes
- Writing the trunk as a missing solution, which turns the whole tree into a case for that solution.
- Mixing causes and consequences on the same level, so the tree is a list with lines on it.
- Drawing links that feel obvious without checking them.
- Working on branches, which treats symptoms while the roots stay in place.
What you walk away with
You leave with one agreed central problem, its causes arranged in roots and its consequences in branches, every link either supported by evidence or marked to check, and a short choice of roots to work on and branches to watch. Next, turn each chosen root into a how might we question to open up ideas, or use five whys to go deeper on a root that still feels vague.
Questions people ask
What is the difference between a problem tree and a fishbone diagram?
A fishbone shows the many possible causes of one effect, grouped into families. A problem tree shows causes and consequences together, in layers, and asks you to check each link. Use the tree when you need to explain why the problem matters, not only why it happens.
How do you turn a problem tree into an objective tree?
Rewrite each item as a positive condition: requests need three signatures becomes requests need one signature. The trunk becomes the goal and the branches become the benefits. Check that the new links still make sense.
How long does a problem tree take?
About 45 minutes for a first draft with a team that has research to hand. Checking the weaker links can take another few days.
Tool card
The worksheet your team fills in, one box per field.
- Problem
- Cause
- Consequence
- Evidence