
Value chain analysis
Lay out every activity that turns inputs into value for your users, then find where cost, strength and dependency point to a change.
- Time
- 60 min
- People
- 4–8
- Kind of work
- Understand · Frame

In short
Value chain analysis is a strategy method that breaks a service into the activities that create value for users, from intake to aftercare. To run it, a team lists each activity in order, notes what it contributes, what drives its cost and what it depends on, and then marks where evidence suggests a change would make the biggest difference.
What it is
A value chain is the sequence of activities an organisation performs to deliver something people value. The idea was set out by Michael Porter at Harvard Business School, who separated primary activities, the ones that directly produce and deliver the service, from support activities such as technology, people and procurement. Value chain analysis looks at each activity and asks two questions: what value does this add, and what does it cost us?
The method helps when strategy talk stays too abstract. Once the chain is on the wall, people can see that most cost sits in one manual check, or that the activity users praise most depends on a single team. It turns a vague goal like improve efficiency into a short list of specific activities where a change is worth testing.
When to use it
Use it when
- You need to cut cost or improve a service and want to know where to look first.
- You are deciding which activities to keep in-house, share or outsource.
- Leaders want to understand where the organisation is genuinely strong compared with others.
- A new service is being designed and you want to check every activity has a clear purpose.
- You have finished a competitive forces analysis and need to see where you can respond.
Skip it when
- You need a step-by-step picture of one process with decisions and handoffs; draw a process flowchart instead.
- You want to understand the user's experience and feelings; use an experience map.
- There is no cost or effort data at all and no way to estimate it.
You need
- Time
- 60 minutes for the workshop, plus time beforehand to collect rough cost and volume figures.
- People
- 4–8 people who run the activities, plus someone from finance who knows where costs sit.
- Materials
- A long wall or digital board, sticky notes in three colours, rough cost or staff-time figures per activity.
How to run it
Step 1: Name the value
Agree in one sentence what users get at the end of the chain. For example: a patient leaves with a confirmed diagnosis and a treatment plan. Every activity you add must connect to this sentence.
Step 2: List the primary activities
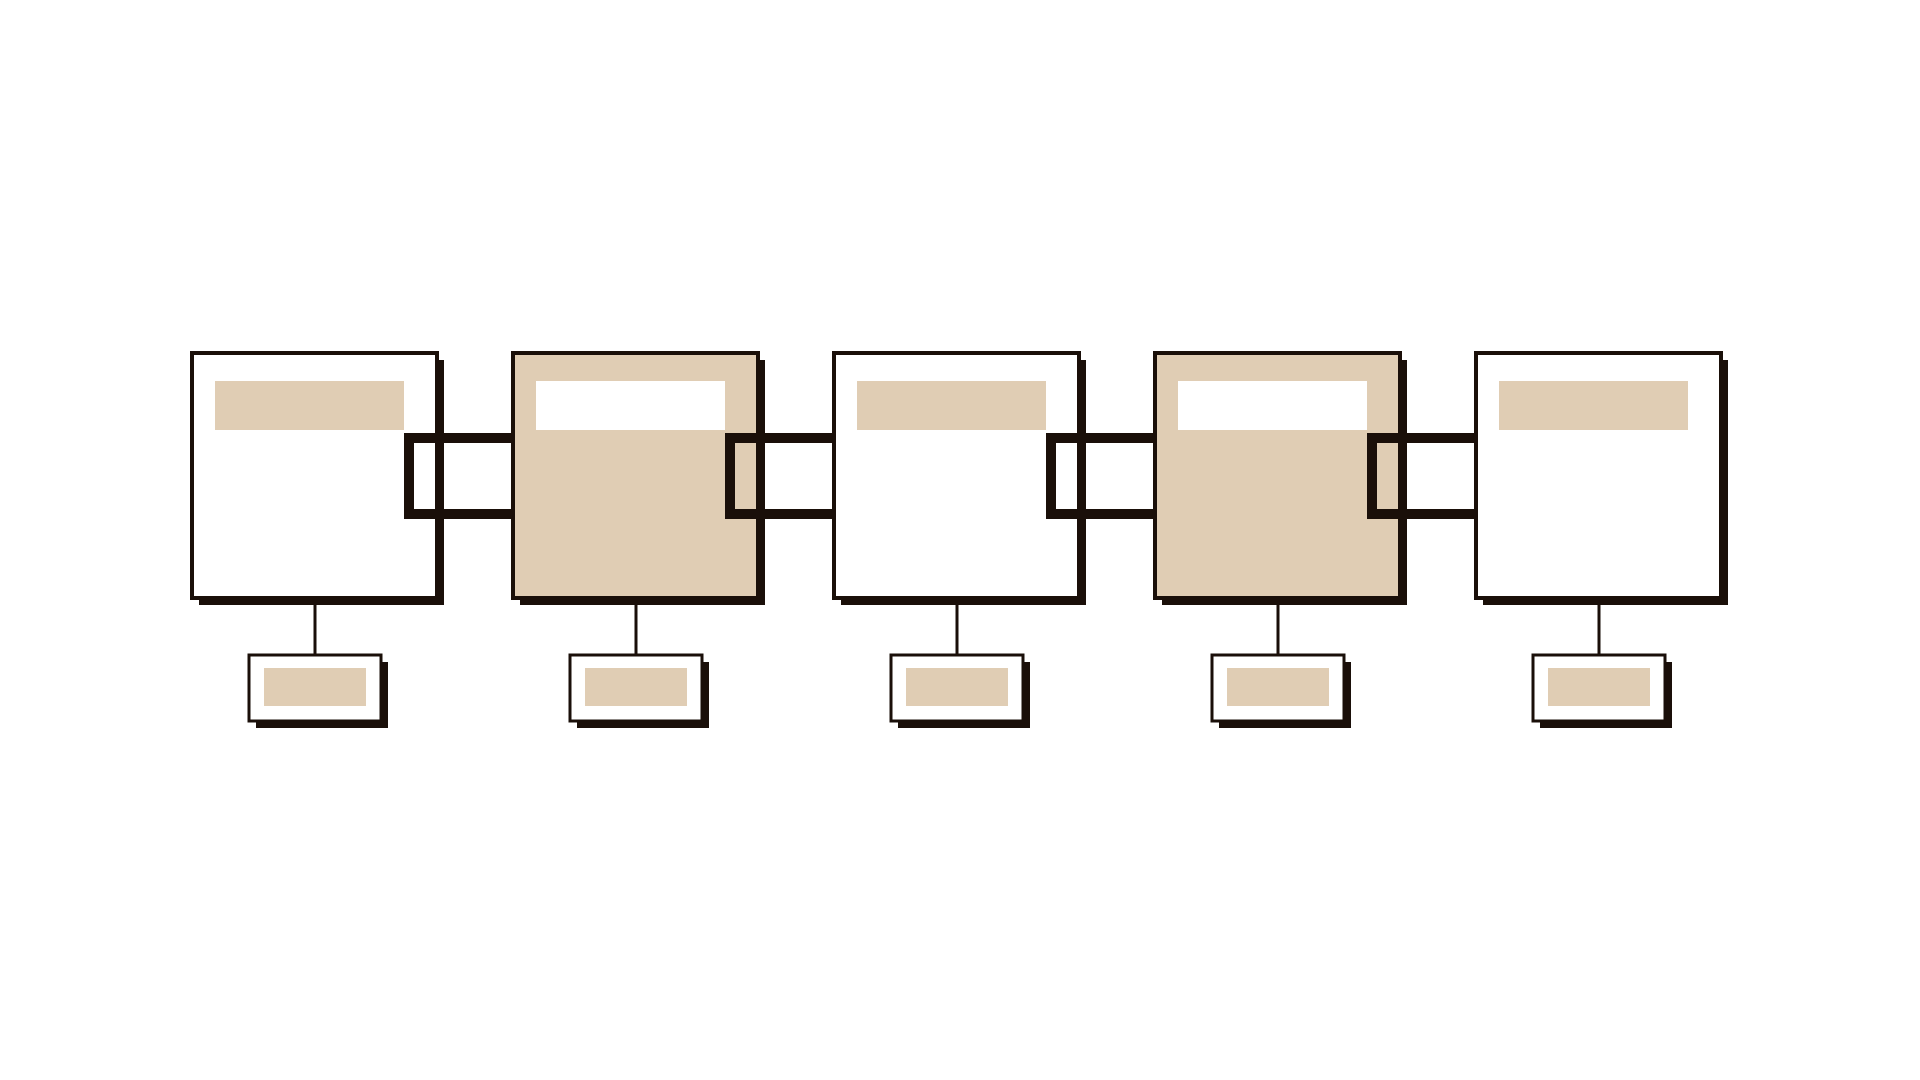
Ask the group to write each activity that directly delivers the service on its own note, then place them left to right in order. Aim for 6 to 12 activities. Merge any that overlap.
Step 3: Add support activities
Underneath the row, add the activities that make the chain possible: systems, training, purchasing, facilities. Draw a line from each support activity to the primary ones it serves.
Step 4: Note value and cost driver
For each activity, write what it contributes to the user and what drives its cost, such as staff hours, rework, licences or waiting time. Use a second colour for cost. Rough figures are fine; mark estimates clearly.
Step 5: Mark dependencies
Ask which activities depend on one person, one system or one supplier. Mark these with a third colour. Single points of failure often explain both high cost and weak value.
Step 6: Find the opportunities
Look for three patterns: high cost with low value, high value that is fragile, and activities users never notice. Write an opportunity note for each and back it with the evidence on the board.
Step 7: Choose what to explore
Agree two or three opportunities to investigate further. Give each one an owner role and a next step, such as gathering better data or mapping that activity in detail.
Worked example
A hospital outpatient department wanted to reduce waiting times without adding staff.
Seven people from reception, nursing, the clinic, the laboratory and finance agreed the value: a patient leaves with a clear next step on the day of the visit.
They listed nine primary activities from booking to follow-up letter. Support activities included the booking system, lab equipment maintenance and nurse rostering.
Finance had staff-time figures. Re-entering patient details at the clinic desk took 6 minutes per visit and added no value the patient could see. It existed because the booking system and the clinic system did not share data.
The lab result step had high value but depended on a single courier run at noon. Patients seen in the afternoon often waited for the next day.
The team chose two opportunities: test a data link between the two systems, and add a second courier run for a month. The second change cut next-day callbacks noticeably within four weeks.
IllustrativeTips and mistakes
Tips
- Use verbs for activities, such as check documents, so people describe work rather than departments.
- Invite the people who do the work, not only their managers; they know where the rework is.
- Keep cost figures rough but consistent, such as staff minutes per case.
- Photograph the board and redraw it cleanly within a day while memory is fresh.
- Revisit the chain after a change to see whether cost moved somewhere else.
Common mistakes
- Drawing the organisation chart instead of the activities. Departments are not activities.
- Listing activities without any cost or value notes, which leaves nothing to decide.
- Treating support activities as overhead to cut, when they often hold the chain together.
- Jumping to solutions before the whole chain is on the wall.
What you walk away with
You leave with a clear chain of primary and support activities, each with its contribution, cost driver and dependencies, plus two or three evidenced opportunities with owners. Use a process flowchart to look closely at any activity you want to change, or benchmarking to see how your costs for that activity compare.
Questions people ask
How long does a value chain analysis take?
A first workshop takes about 60 minutes if rough cost figures are ready. Expect a second short session if finance needs time to firm up the numbers.
Value chain vs process map: what is the difference?
A value chain shows all the activities that create value and their costs at a high level. A process map shows the detailed steps, decisions and handoffs inside one activity.
Can a public service use value chain analysis?
Yes. Replace profit with value to citizens or patients, and the method works the same way: it shows which activities add value and what each one costs.
Tool card
The worksheet your team fills in, one box per field.
- Activity
- Value contribution
- Cost driver
- Dependency
- Opportunity