
Balanced scorecard
Look beyond one headline number by choosing a few linked measures across four views of how the organisation is doing.
- Time
- 60 min
- People
- 5–8
- Kind of work
- Plan · Scale

In short
A balanced scorecard is a management method that tracks a small set of measures across four perspectives: financial or mission outcomes, customers, internal operations, and learning and capability. For each perspective you set objectives, measures, baselines, targets and owners, then check that the measures link logically. A first draft takes about an hour.
What it is
Organisations often steer by one kind of number, usually money or volume. The balanced scorecard, developed in the early 1990s by Robert Kaplan and David Norton, adds three other views so leaders can see causes as well as results. The four perspectives are usually outcomes (financial results, or mission results in public bodies), customers, internal processes, and learning and growth, which covers people, skills, data and systems.
The word balanced matters. The aim is a small set of measures, often three or four per perspective, that together give a fair picture. The measures should also connect: better capability should improve processes, which should improve the customer experience, which should improve outcomes. Testing those links is what turns a list of indicators into a view of how the strategy is meant to work.
When to use it
Use it when
- When leaders track many figures but cannot see which ones drive results.
- When an organisation measures money or volume closely but knows little about customers or staff capability.
- When a strategy has been agreed and needs a regular way to check whether it is working.
- When a public body needs to report on mission outcomes, not just spending.
Skip it when
- For a short project with one clear outcome. A few OKRs are lighter and quicker.
- When there is no agreed strategy yet. The scorecard measures a strategy; it does not create one.
- To compare or rank individual staff. The scorecard is about the organisation's performance.
You need
- Time
- 60 minutes for a first draft, then a session to check the data and set baselines.
- People
- 5 to 8 people, including leaders from each area and someone who knows what data exists.
- Materials
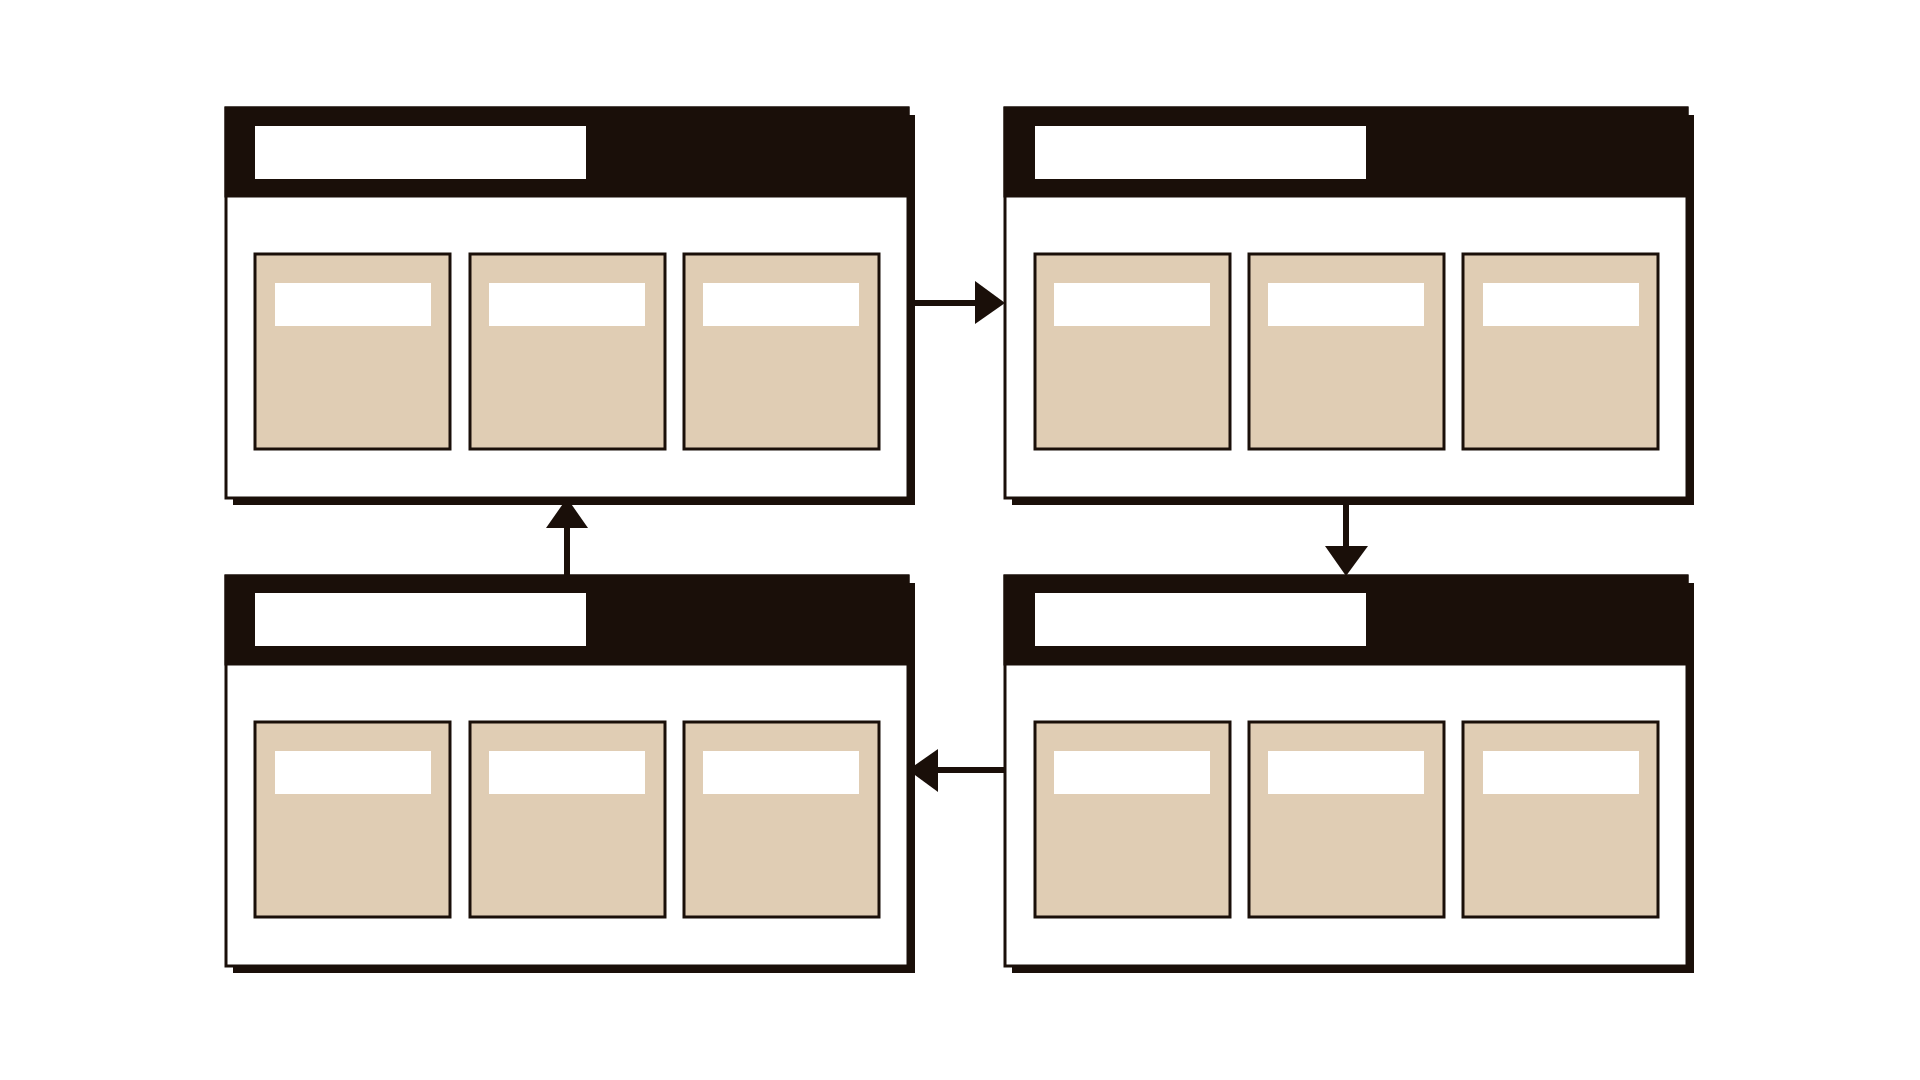
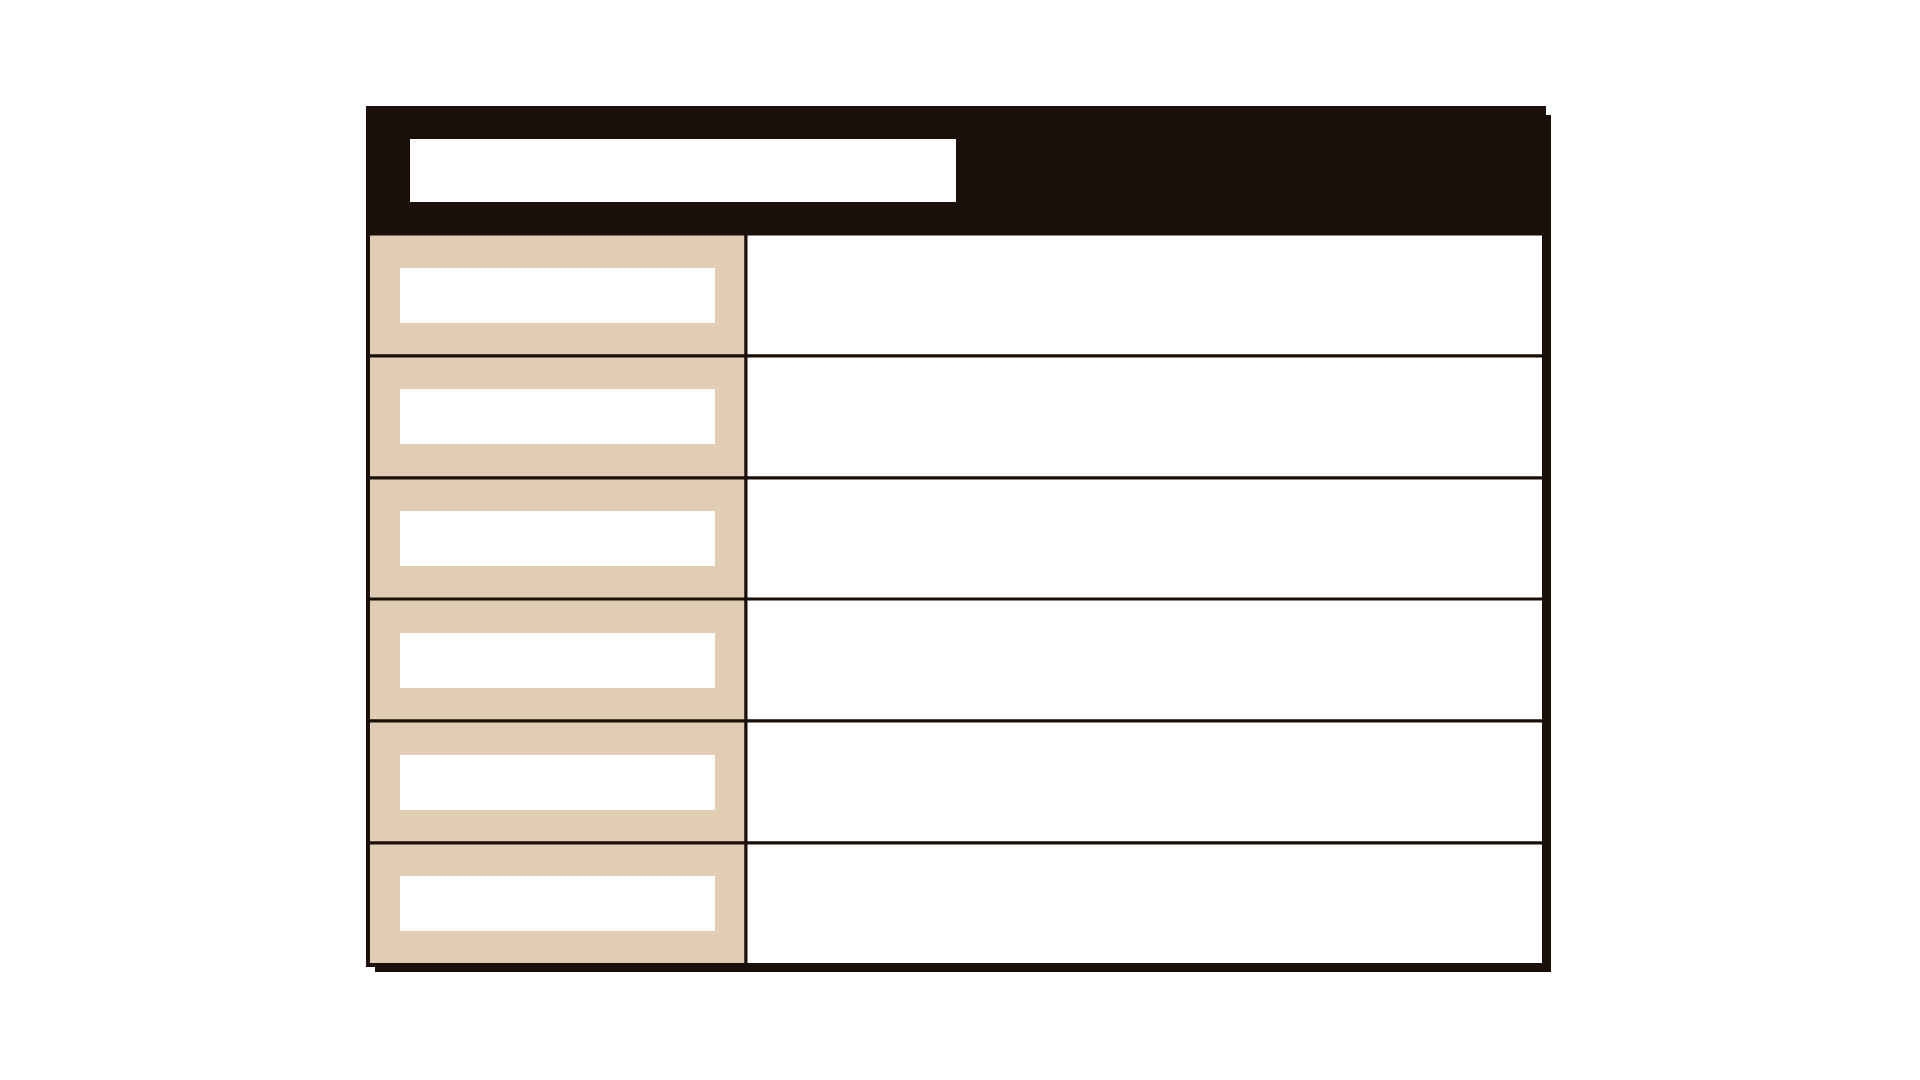
- A four-panel board, one panel per perspective, sticky notes, the strategy on one page, and a worksheet with six fields.
How to run it
Step 1: Put the strategy on the wall
Start with the agreed strategy, in a sentence or a few bullets. Every objective you write should trace back to it. If it is not clear, stop and agree it first.
Step 2: Write objectives for each perspective
Give 15 minutes. For each of the four panels, write two or three objectives. Outcomes: what result matters most? Customers: what must they experience? Operations: which processes must excel? Capability: what skills, data and systems are needed?
Step 3: Choose a small set of measures
For each objective, choose one measure, two at most. Prefer measures you can get regularly. Aim for no more than 12 to 16 measures across the whole scorecard.
Step 4: Test the links
Draw arrows between panels. Does a capability objective support a process objective? Does that process improve what customers experience? If an objective links to nothing, question whether it belongs.
Step 5: Set baselines and targets
Write today's value for each measure. Where there is no baseline, plan how to get one. Set a target for the period, and agree how often each measure is reviewed.
Step 6: Assign owners and a review rhythm
Name a role for each objective. Agree a regular review, often monthly for operations measures and quarterly for the full scorecard. Use the review to ask why, not just what.
Worked example
A regional telecom operator wanted to see whether its plan to improve home internet service was working. Seven leaders from network, customer care, finance, HR and data drafted a scorecard in an hour.
The strategy was: win and keep home internet customers by offering the most reliable service in the region.
Outcomes: grow home internet revenue and reduce customers leaving. Customers: fewer service outages and faster fixes. Operations: first-visit repair rate and time to install. Capability: field technicians trained on the new fibre equipment and reliable network data.
They chose 13 measures in total, including monthly customer losses, average outage minutes per customer, first-visit repair rate, and the share of technicians trained.
Drawing the links, the group saw that training technicians should raise first-visit repairs, which should shorten outages and reduce customers leaving. They also found a gap: no measure covered call centre waiting time, which customers complained about most. They added it under Customers.
Baselines were available for 10 measures. The data lead took on the other three. The full scorecard would be reviewed quarterly by the leadership team, with operations measures checked monthly.
IllustrativeTips and mistakes
Tips
- Keep the scorecard small. Twelve measures that people discuss are worth more than forty that nobody reads.
- In public bodies, put mission outcomes at the top in place of profit.
- Mix leading measures, which move early, with lagging ones, which confirm results later.
- Show the four panels together on one page, so nobody reads one view in isolation.
Common mistakes
- Putting every existing indicator onto the scorecard.
- Filling the capability panel last and leaving it vague, so its link to results is never tested.
- Using the scorecard to judge individuals rather than to understand performance.
- Reviewing figures without asking why they moved.
What you walk away with
You leave with a draft scorecard of objectives and 12 to 16 measures across four perspectives, with baselines, targets, owners, a review rhythm and a simple map of how they connect. Use a KPI tree to break a top measure into its drivers, and OKRs to set quarterly goals for the measures you most want to move.
Questions people ask
What are the four perspectives of the balanced scorecard?
Financial or mission outcomes, customers, internal processes, and learning and growth. Public bodies often rename the first as mission or public value and place it at the top.
How many measures should a balanced scorecard have?
Most teams aim for three or four per perspective, so 12 to 16 in total. Fewer can miss important areas; many more becomes hard to review.
Balanced scorecard vs OKRs?
A balanced scorecard is an ongoing view of performance across four perspectives. OKRs are time-bound goals for change. Many organisations use the scorecard to watch performance and OKRs to drive specific improvements each quarter.
Tool card
The worksheet your team fills in, one box per field.
- Perspective
- Objective
- Measure
- Baseline
- Target
- Owner