
Opportunity solution tree
Start from one measurable outcome, branch into opportunities you have evidence for, and test solutions with small experiments.
- Time
- 60 min
- People
- 3–6
- Kind of work
- Frame · Generate · Test

In short
An opportunity solution tree is a visual map that connects a measurable outcome to the user needs, pain points and desires that could move it, then to possible solutions and small experiments. To build one, set the outcome, branch into evidenced opportunities, compare a few solutions for the chosen opportunity, and design quick tests without assuming any link is proven.
What it is
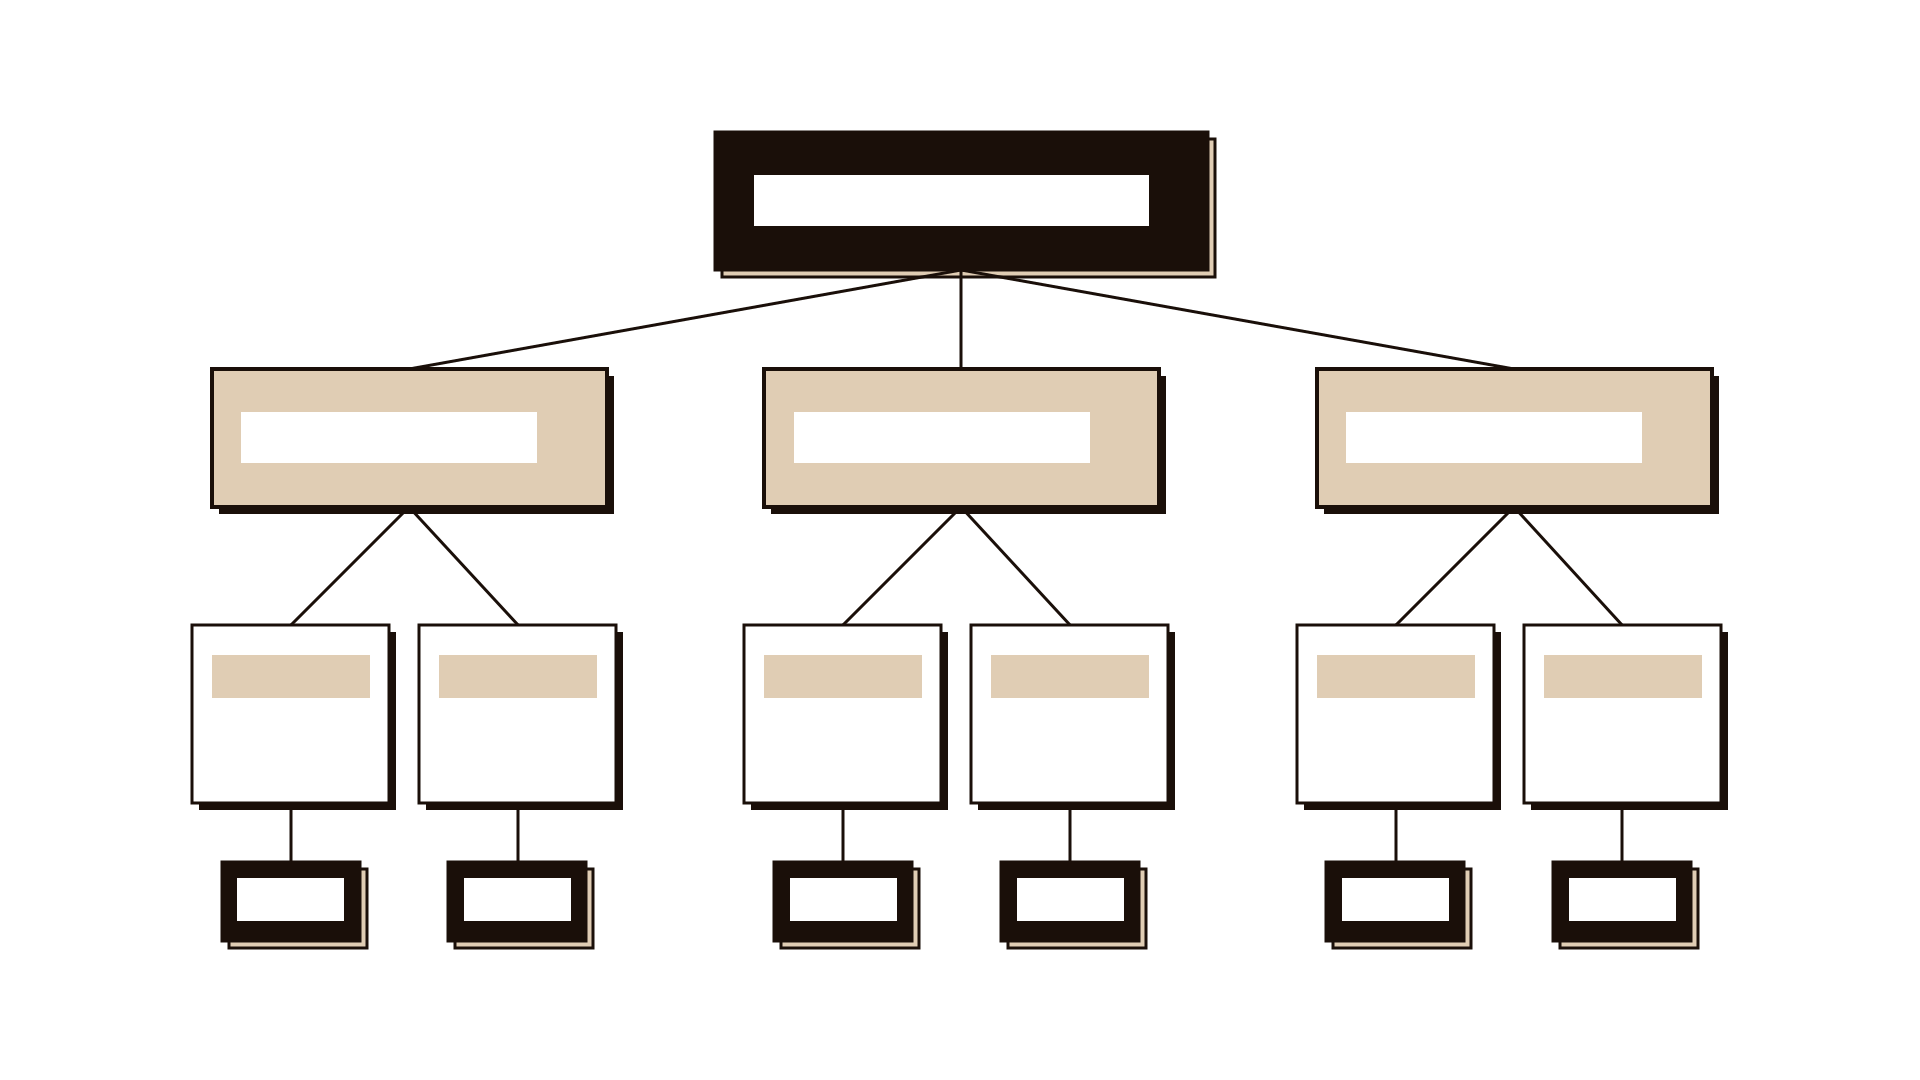
The opportunity solution tree was introduced by the product discovery coach Teresa Torres. It gives a team one picture of how its daily choices connect to the result it is asked to deliver. At the top sits an outcome, such as fewer failed inspections. Below it sit opportunities: needs, problems or wishes that users have, found through research. Below each opportunity sit solutions, and below each solution sit experiments that test whether it works.
The tree helps teams avoid two common traps. One is jumping from a goal straight to a favourite solution. The other is working on many ideas that do not connect to the outcome at all. By keeping several opportunities and several solutions in view, the team can compare and choose, and change direction when an experiment shows that an assumption was wrong.
When to use it
Use it when
- Your team has been given an outcome to improve but no clear plan for how.
- Ideas are flowing but nobody can explain how they connect to the goal.
- You have research findings and need to turn them into choices.
- Stakeholders keep proposing solutions and you want to show the wider set of options.
- You want a living map to guide discovery work over several weeks.
Skip it when
- There is no agreed outcome yet; settle the outcome first with a KPI tree or leadership.
- You have no user evidence at all; run some interviews or observation before building the tree.
- The solution is fixed by regulation and only delivery planning remains.
You need
- Time
- 60 minutes for a first tree; then short updates each week as you learn.
- People
- 3–6 people: product or service lead, a researcher or someone who talks to users, and someone who builds or delivers.
- Materials
- A large board or digital canvas, cards in four colours for outcome, opportunity, solution and experiment, and your research notes.
How to run it
Step 1: Set one measurable outcome
Write the outcome at the top. It should be something the team can influence and measure, such as raise first-time inspection pass rate from 55 to 70 percent. Avoid outputs like launch a new form.
Step 2: Map opportunities from evidence
From your research, write user needs, pain points and wishes as opportunities, one per card. Phrase them from the user's view, such as I do not know what the inspector will check. Place them under the outcome.
Step 3: Structure the opportunities
Group related opportunities and break large ones into smaller, more specific children. A good opportunity is small enough that a team could address it in a few weeks.
Step 4: Choose one opportunity
Compare the opportunities on how much each might move the outcome, how many users it affects and how strong the evidence is. Choose one to work on now. Leave the rest on the tree.
Step 5: Generate several solutions
For the chosen opportunity, sketch at least three different solutions. Three options keep the team from falling in love with the first idea and make comparison possible.
Step 6: Design small experiments
Under each solution, write the riskiest assumption and a quick experiment to test it, such as a paper checklist given to 10 applicants. Each experiment should take days, not months.
Step 7: Run, learn and update
Run the experiments, record what you learn, and update the tree. Remove solutions that fail, add new opportunities you discover, and revisit the tree every week.
Worked example
A municipal building control department wanted to raise the share of construction sites that pass their first inspection.
Five people built the tree. The outcome was: raise first-time pass rate for final inspections from 55 to 70 percent within a year.
From 15 interviews with contractors and inspectors, they wrote 11 opportunities. Three stood out: contractors did not know what inspectors would check, they booked inspections before sites were ready, and they could not reach an inspector with quick questions.
They chose sites booked before ready, since the inspection records showed that a large share of failures happened on sites still unfinished, with materials and fencing still in place.
Three solutions were sketched: a pre-inspection self-check list, a short video call with an inspector before booking, and a booking form that asks for photos of key items. Each had an experiment.
The photo-upload experiment with 20 contractors cut unready bookings sharply, while the video call was hard to schedule. The team kept the photo step, dropped the call, and moved to the next opportunity on the tree.
IllustrativeTips and mistakes
Tips
- Phrase opportunities in the user's words; it keeps solutions out of the opportunity layer.
- Insist on at least three solutions per chosen opportunity.
- Mark how strong the evidence is on each opportunity card.
- Keep experiments small and fast; aim for results in a week.
- Show the tree to stakeholders; it explains why you are not building their idea yet.
Common mistakes
- Putting solutions in the opportunity layer, such as we need an app.
- Treating the links in the tree as proven when they are assumptions to test.
- Building the tree once and never updating it.
- Choosing an outcome the team cannot influence.
What you walk away with
You leave with a visual tree linking one outcome to evidenced opportunities, a chosen opportunity, several solutions and a set of small experiments ready to run. Use a hypothesis test to design each experiment carefully, or assumption mapping to decide which assumptions to test first.
Questions people ask
How long does it take to build an opportunity solution tree?
A first version takes about an hour if you have research to draw on. After that, the tree is updated in short sessions each week as experiments return results.
Opportunity solution tree vs KPI tree: what is the difference?
A KPI tree breaks an outcome into the measures that drive it. An opportunity solution tree connects an outcome to user needs, solutions and experiments. A KPI tree can help you choose the outcome at the top of the tree.
Who created the opportunity solution tree?
It was introduced by Teresa Torres, a product discovery coach, as a way to make continuous discovery work visible and connected to outcomes.
Tool card
The worksheet your team fills in, one box per field.
- Outcome
- Opportunity
- Evidence
- Solution
- Experiment