
Service blueprint
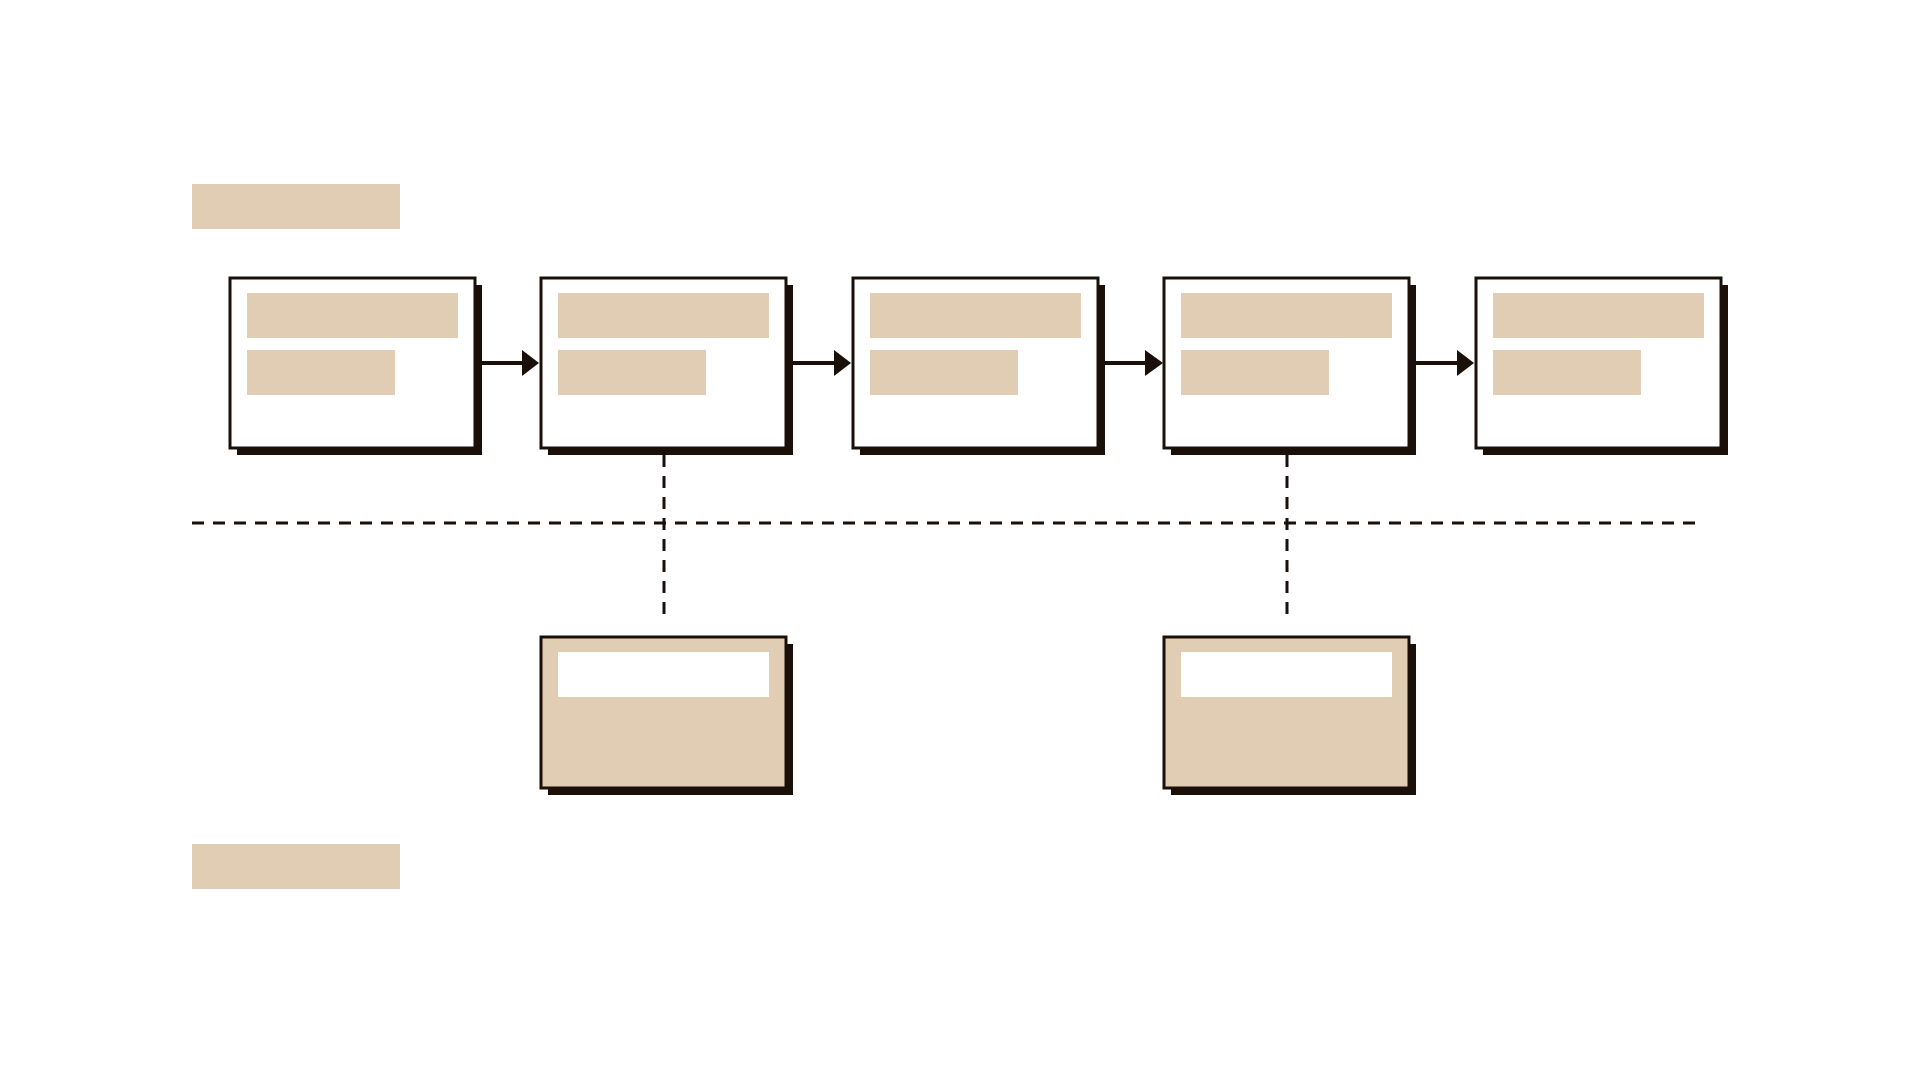
Lay the customer's steps across the top, then show everything the organisation does, in sight and out of sight, to make each step happen.
- Time
- 90 min
- People
- 4–8
- Kind of work
- Frame · Plan

In short
A service blueprint is a diagram of one service that lines up what the customer does with the frontstage staff, backstage work and support systems behind each step. To build one, choose a single scenario, map the customer actions first, add the lanes underneath, then mark the fail points, waits and hand-offs between teams.
What it is
A service blueprint is a map of one service drawn in horizontal lanes. The top lanes show the customer's side: the physical or digital evidence they meet, such as a letter, a text message or a counter, and the actions they take. Below that sit the staff and systems the customer sees, the frontstage. A line of visibility separates them from the backstage: the people and steps the customer never sees. The bottom lane holds support processes, such as IT systems, policies and other departments, that the whole service depends on.
The method was introduced by G. Lynn Shostack in the Harvard Business Review in 1984 and is now one of the core tools of service design. Where a journey map tells you how the experience feels, a blueprint tells you why it works or breaks, because it shows the hidden work that produces each moment. In this worksheet you record evidence, customer actions, frontstage, backstage, support processes, fail points and waits for each step.
When to use it
Use it when
- Customers complain about delays or repeat visits and nobody can say where in the organisation the time goes.
- Several departments each own a piece of a service and no one has seen the whole of it on one page.
- You are about to redesign or digitise a service and need to know which backstage steps a change will affect.
- You have a journey map that shows pain points and now need to find their causes inside the organisation.
- A new team, supplier or system is taking over part of a service and the hand-offs must be agreed before go-live.
Skip it when
- You do not yet know how customers experience the service. Do interviews or observation first, or the top lanes will be guesses.
- The question is about the wider network of partners and value, not one service. A system map or ecosystem map fits better.
- The process is purely internal with no customer moments, such as month-end closing. A process flowchart is simpler and enough.
You need
- Time
- About 90 minutes for one scenario with people who know the work; allow a second session to check it against real cases.
- People
- 4 to 8 people: someone who did the customer research and at least one person from each team that touches the service, including frontline staff.
- Materials
- A long wall or shared board with the lanes drawn, sticky notes in two or three colours, journey or research notes, and a few real case files to trace.
How to run it
Step 1: Pick one scenario and its edges
Agree which customer, which service and which situation you are mapping, for example "a household applying for a new water connection to a finished villa". Write where the scenario starts and where it ends. One blueprint per scenario keeps it readable; an unusual case, such as a rejected application, gets its own blueprint later.
Step 2: Map the customer actions first
Fill the customer actions lane from left to right using what research showed, not what the procedure says should happen. Use one note per action, written as a verb: "submits form", "waits for call", "pays fee". Above each action, note the evidence the customer sees or holds at that moment, such as an SMS, a receipt or a site visit card.
Step 3: Add the frontstage
For each customer action, write which staff member, screen or channel the customer deals with directly. Leave the cell empty if there is nothing; an empty frontstage cell during a long wait is a finding in itself. Draw the line of visibility clearly under this lane.
Step 4: Trace the backstage and support work
Ask the people who do the work to fill the backstage lane: the checks, approvals, scheduling and data entry that happen out of sight. Below that, add the support processes and systems each step relies on. Trace one or two real case files through the map to check that nothing is missing.
Step 5: Draw the hand-offs
Draw an arrow every time work passes from one team, system or person to another. Count them. Hand-offs are where cases wait in queues, get lost or are passed back, so they deserve their own colour on the wall.
Step 6: Mark fail points and waits
Put a red mark on each step where things often go wrong, and write the typical waiting time between steps, using real data where you have it. Link each fail point to the customer moment it causes. This is the part of the blueprint leaders read first.
Step 7: Agree what to change and who owns it
Choose the two or three fail points with the biggest effect on customers and name an owner for each. Photograph or transcribe the blueprint, date it and store it where the teams can update it as the service changes.
Worked example
A regional water utility took an average of 34 working days to connect a new household, against a published target of 15. Customers called the contact centre an average of four times per application to ask for news, and the utility's journey map showed long silent gaps that nobody could explain.
Seven people met for 90 minutes: a customer researcher, a contact centre agent, a connections planner, a site surveyor, a billing officer, an IT analyst and the connections manager. They chose the scenario "new connection for a completed villa with an approved building permit".
The customer lane had only six actions, from applying online to receiving the first bill. The backstage lane needed 19 notes and showed nine hand-offs between four teams.
Tracing two real case files showed that site surveys were scheduled in one weekly batch, so an application that arrived on a Tuesday could wait six days before anyone looked at it.
The frontstage lane was empty for 22 of the 34 days. During that time the customer received no message at all, which explained most of the calls.
A fail point appeared at payment: the fee was calculated after the survey, but the payment link expired after 48 hours, and about one in five customers missed it and had to start again.
The team agreed three changes with named owners: daily survey scheduling, an automatic SMS at each internal milestone, and a payment link valid for 14 days. They planned to measure days to connect and calls per application for the next three months.
IllustrativeTips and mistakes
Tips
- Start from real cases, not the procedure manual. The gap between the two is usually where the problems are.
- Keep the customer lane short and plain. If it has more notes than the backstage, you may be mapping screens instead of actions.
- Invite frontline staff and let them write the backstage notes themselves. They know the workarounds that the official process leaves out.
- Put times on the wait arrows. A blueprint with numbers moves leaders faster than one with only boxes.
Common mistakes
- Mapping several customer types at once, so the lanes fill with "if" branches and nobody can read the result.
- Stopping at the line of visibility, which turns the blueprint into a journey map and hides the causes.
- Drawing the service as it is supposed to work rather than as it actually works.
- Leaving the blueprint on a wall after the workshop, so it is out of date within weeks and no one owns the fixes.
What you walk away with
You leave with a dated blueprint of one scenario that shows every customer step, the frontstage and backstage work behind it, the hand-offs and the fail points, plus two or three agreed changes with owners. The next step is often a touchpoint matrix to plan channels, or a process flowchart for any backstage step that needs a detailed redesign.
Questions people ask
What is the difference between a service blueprint and a customer journey map?
A journey map follows the customer and records what they do, think and feel. A blueprint takes those same steps and adds the staff, systems and support processes behind them, so you can see why each moment goes well or badly. Many teams build the journey map first and the blueprint second.
What is the line of visibility in a service blueprint?
It is the line that separates what the customer can see, such as a counter clerk or a website, from the backstage work they cannot see, such as approvals and scheduling. Moving work across that line, in either direction, is one of the main design choices a blueprint helps you make.
How detailed should a service blueprint be?
Detailed enough that someone from each team recognises their own work and can point to where cases wait. For a first version, 6 to 12 customer actions is usually right. If a single backstage step needs more detail, map it separately with a process flowchart.
Tool card
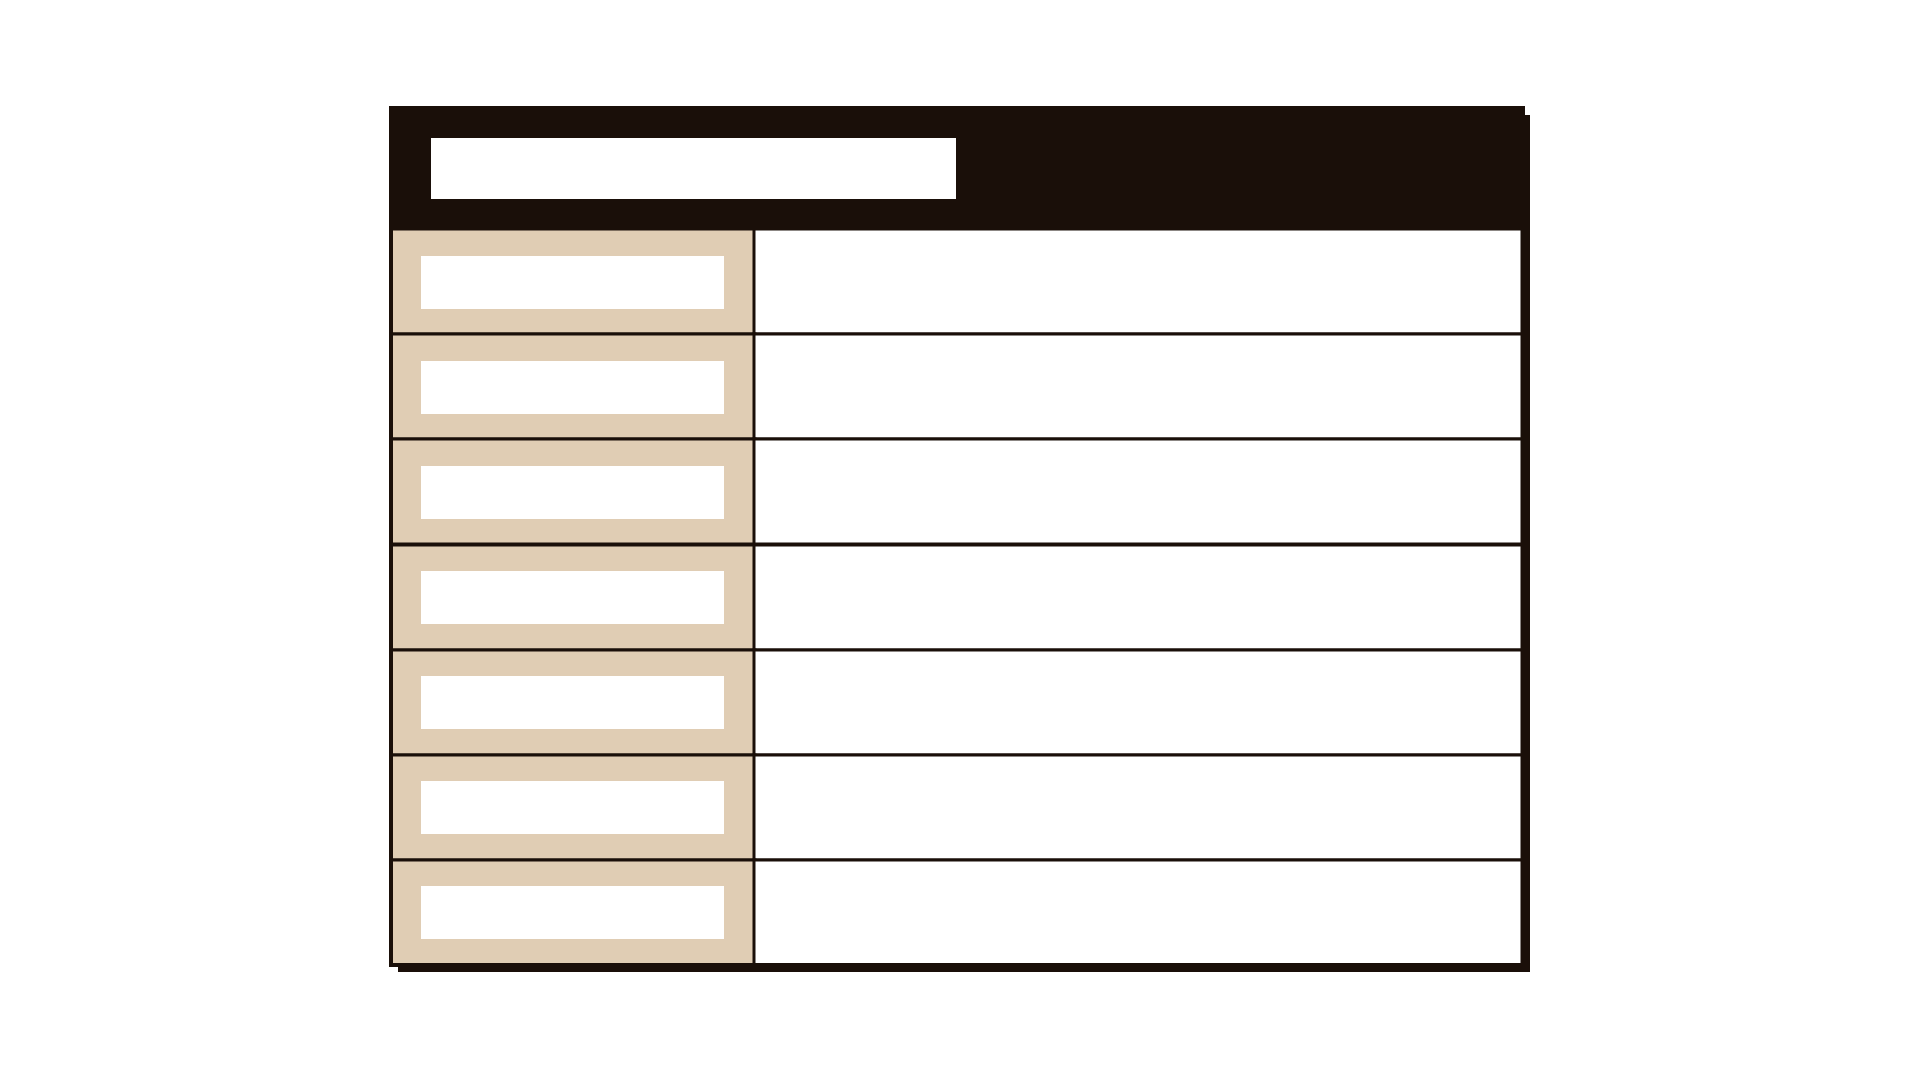
The worksheet your team fills in, one box per field.
- Evidence
- Customer actions
- Frontstage
- Backstage
- Support processes
- Fail points
- Wait times