
System map
Draw the service as a system: who and what is involved, in rings around the person it serves, and what flows between them.
- Time
- 60 min
- People
- 3–6
- Kind of work
- Understand · Frame

In short
A system map is a diagram of everyone and everything involved in delivering one service, arranged in rings around the person it serves, with arrows for the money, information, goods and decisions that pass between them. To make one, put the person at the centre, add actors ring by ring, draw the flows, then mark the breaks and loops.
What it is
A system map shows a service from the inside as a set of connected parts. At the centre is the person the service is for. The first ring holds the people closest to them, such as family members or carers. The next ring holds the service itself: the staff, teams, channels and tools the person deals with. The outer ring holds what sits behind it: other departments, suppliers, regulators, funders and systems. Arrows between the parts show what flows: money, information, physical goods and decisions.
System mapping is widely used in service design and systemic design to see how a problem is produced by the way parts connect, not by one team or one step. It differs from a stakeholder map, which ranks people by interest and influence, and from an ecosystem map, which looks across many organisations and the value they exchange. In this worksheet you record the person at the centre, the people around them, the service, what sits behind it, the flows, and the breaks and loops you find.
When to use it
Use it when
- A problem keeps coming back after each fix, and you suspect the cause sits between teams rather than inside one.
- You are new to a service and need a shared picture of who is involved before planning research.
- Several organisations each hold part of the information a person needs, and nobody knows where it gets lost.
- You need to explain to leadership why a change in one place will have effects somewhere else.
- You are choosing where to intervene and want to find the points where a small change could shift the whole service.
Skip it when
- You need the step-by-step detail of one customer journey. A journey map or service blueprint will show it more clearly.
- The real question is who to involve and how to manage them. A stakeholder map is quicker and more direct.
- The service is small and run by one team with one channel. A map will only restate what everyone already knows.
You need
- Time
- About 60 minutes for a first map; allow time afterwards to check it with people outside the room.
- People
- 3 to 6 people from different parts of the service, ideally including someone who works on the front line and someone who has spoken with service users.
- Materials
- A large sheet or shared board with three rings drawn around a centre, sticky notes, and markers in four colours, one for each kind of flow.
How to run it
Step 1: Put one person at the centre
Write the person the service exists for in the middle, as specifically as you can, for example "a patient over 70 going home after a hip operation". A named situation keeps the map grounded. If you have two very different users, make two maps.
Step 2: Fill the inner ring
Add the people closest to that person who shape how the service works for them: family, carers, neighbours, employers. These people often do unpaid work that the service depends on but never records, so ask about them directly.
Step 3: Add the service ring
List every team, role, channel and tool the person deals with directly: counters, call centres, websites, visiting staff, letters, apps. Use one note each. Write job roles rather than names of individuals, so the map still holds when people change.
Step 4: Add what sits behind it
In the outer ring, put the organisations, departments, suppliers, regulators, funders and IT systems that the service relies on but the person rarely sees. Ask "who has to say yes?" and "where does the data live?" to find the ones people forget.
Step 5: Draw the flows
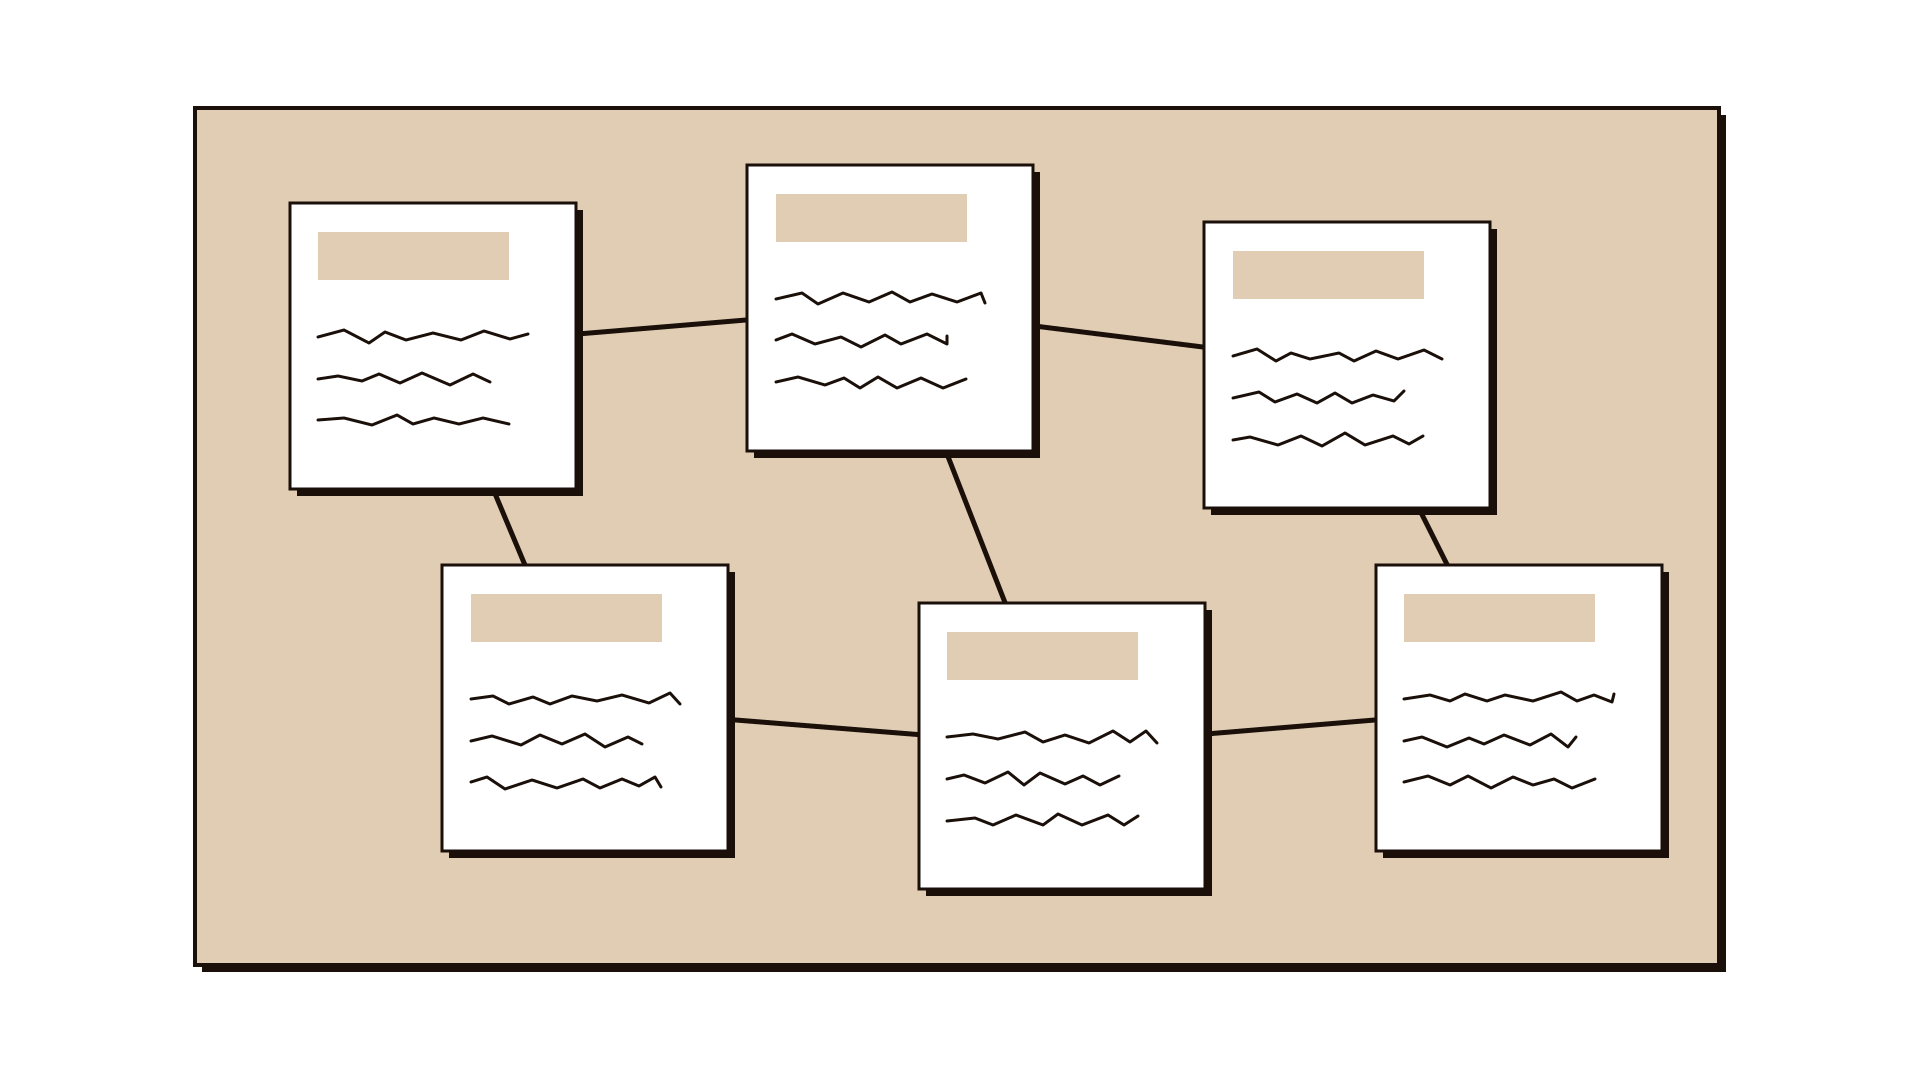
Draw arrows between the notes, using one colour each for money, information, goods and decisions. Write a few words on each arrow, such as "discharge summary" or "monthly payment". Where a flow should exist but does not, draw a dotted arrow.
Step 6: Mark breaks and loops
Circle the places where a flow is slow, missing, duplicated or goes through the person because the organisations do not talk to each other. Look for loops, where one problem feeds another. These are the findings the map exists to produce.
Step 7: Choose where to look next
Pick two or three breaks that most affect the person at the centre. For each, write the question you now need to answer and who could answer it. Date the map and treat it as a draft to check with people who were not in the room.
Worked example
A general hospital found that 18% of patients over 70 discharged after orthopaedic surgery were readmitted within 30 days. Ward staff blamed home care, home care blamed late paperwork, and a pilot that added a discharge checklist had made no difference after six months.
Five people met for an hour: a ward nurse, a discharge coordinator, a physiotherapist, a home care team lead from the municipality and a patient experience officer. They put "a patient over 70 going home after a hip operation" at the centre.
The inner ring held an adult son or daughter, a domestic worker and a neighbourhood pharmacist. The group realised the domestic worker often gave the medicines but received no instructions at all.
The service ring held 11 notes, including the ward, the physiotherapy unit, the outpatient clinic and the municipal home care service. The outer ring held 8, among them the insurer, the equipment supplier and two separate patient record systems.
Drawing the information flows showed that the discharge summary reached home care by fax an average of three days after the patient arrived home. The family was carrying the paper copy between the two services.
A loop appeared: the walking frame often arrived late because the insurer approved it only after discharge, so patients stayed in bed, lost mobility and were more likely to fall.
The team chose two breaks to investigate: sending the summary to home care on the day of discharge, and moving equipment approval to before the operation. They booked conversations with the insurer and the records team for the following week.
IllustrativeTips and mistakes
Tips
- Use the rings to start, not as a rule. If an actor sits between two rings, place it on the line and say why.
- Ask "what does this person carry from one place to another?" It often reveals the flows the organisations should be handling.
- Keep a colour key on the sheet. Four kinds of arrows quickly become unreadable without one.
- Show the draft map to two or three people who were not in the room. They will add the actors your group forgot.
Common mistakes
- Drawing the organisation chart instead of the system, so the map shows reporting lines and no flows.
- Leaving the person at the centre vague, such as "citizens", which makes every actor seem equally relevant.
- Adding every possible actor until the map is too dense to discuss, instead of the ones that affect the centre.
- Stopping when the map looks finished, without marking the breaks and loops that make it useful.
What you walk away with
You leave with a dated system map of one service around one person, showing the actors in three rings, the flows of money, information, goods and decisions between them, and two or three marked breaks with the questions to answer next. Good follow-ups are a service blueprint for the steps around a break, or stakeholder interviews with the actors you know least about.
Questions people ask
What is the difference between a system map and a stakeholder map?
A stakeholder map places people by how much they are affected and how much influence they have, to plan engagement. A system map shows how the parts of a service connect and what flows between them, to find where it breaks. You can use both, and the system map often reveals stakeholders you had missed.
What is the difference between a system map and an ecosystem map?
A system map looks at one service from the inside, around one person. An ecosystem map steps back and shows many organisations in a sector and the value they exchange, which is useful for partnerships and scaling. If your question is about one service, start with the system map.
How many actors should a system map have?
Enough to explain the problem at the centre, often 15 to 30 notes for a first map. If you pass 40, check whether you are mapping two services or two different users, and split the map.
Tool card
The worksheet your team fills in, one box per field.
- Person at the centre
- People around them
- The service
- Behind the service
- Flows
- Breaks and loops