
Ecosystem map
Step back from one service and draw the whole field: the organisations involved, what each one gives and gets, and where value is lost.
- Time
- 60 min
- People
- 4–8
- Kind of work
- Understand · Scale

In short
An ecosystem map is a diagram of the many organisations active around a shared outcome and the value that passes between them, such as money, data, referrals, permissions and trust. To make one, name the outcome, list the actors by type, draw what each gives and receives, then mark gaps, overlaps and the partners you need to scale.
What it is
An ecosystem map looks at a field rather than a service. You start from an outcome that no single organisation can deliver alone, such as "more small food businesses survive their first two years", and place around it every organisation that affects it: government bodies, private firms, funders, community groups, platforms and the people the outcome is for. Lines between them show the value exchanged, written as what one actor gives and the other receives.
Ecosystem mapping is widely used in service design and systemic design when work has to cross organisational boundaries. It is easy to confuse with two neighbours. A system map shows one service from the inside, around one person. A stakeholder map ranks people by interest and influence to plan engagement. An ecosystem map shows many organisations and the value between them, so you can see who to partner with, where effort is duplicated and how a tested solution could spread. In this worksheet you record the shared outcome, the actors, what each gives, what each gets, the gaps and overlaps, and the partners needed to scale.
When to use it
Use it when
- A service has worked in one place and you want to spread it through other entities you do not manage.
- Several government bodies, firms and non-profits all work on the same outcome and nobody has a shared picture of who does what.
- You are designing a partnership or a platform and need to know what each partner would gain from joining.
- Programmes keep overlapping, and leaders want to see where support is duplicated and where people fall through the gaps.
- You are writing a strategy for a sector and need to show where your organisation fits among the others.
Skip it when
- Your question is about why one service fails for its users. A system map or service blueprint will find the cause faster.
- You only need to decide whom to consult and how often. A stakeholder map or communication plan is enough.
- The field is dominated by a single organisation that runs everything end to end; there is little exchange to map.
You need
- Time
- About 60 minutes for a first map, plus short conversations with two or three actors to check the value lines.
- People
- 4 to 8 people who between them know the field: your own team plus, ideally, one or two people from partner organisations.
- Materials
- A large board, sticky notes in one colour per actor type, a marker for value lines, and any existing lists of programmes, partners or registered providers.
How to run it
Step 1: Name the shared outcome
Write in the middle of the board the outcome the whole field contributes to, in words that every actor could agree with, for example "more home-based food businesses become licensed and stay open". An outcome, rather than your own service, keeps the map from turning into a picture of your organisation.
Step 2: List the actors by type
Add every organisation that affects the outcome, one note each, using a colour for each type: government, private sector, funders, community and non-profit, platforms, and the people the outcome is for. Name organisations by role, such as "delivery app" or "regional development fund", so the map can be shared.
Step 3: Draw what each gives and gets
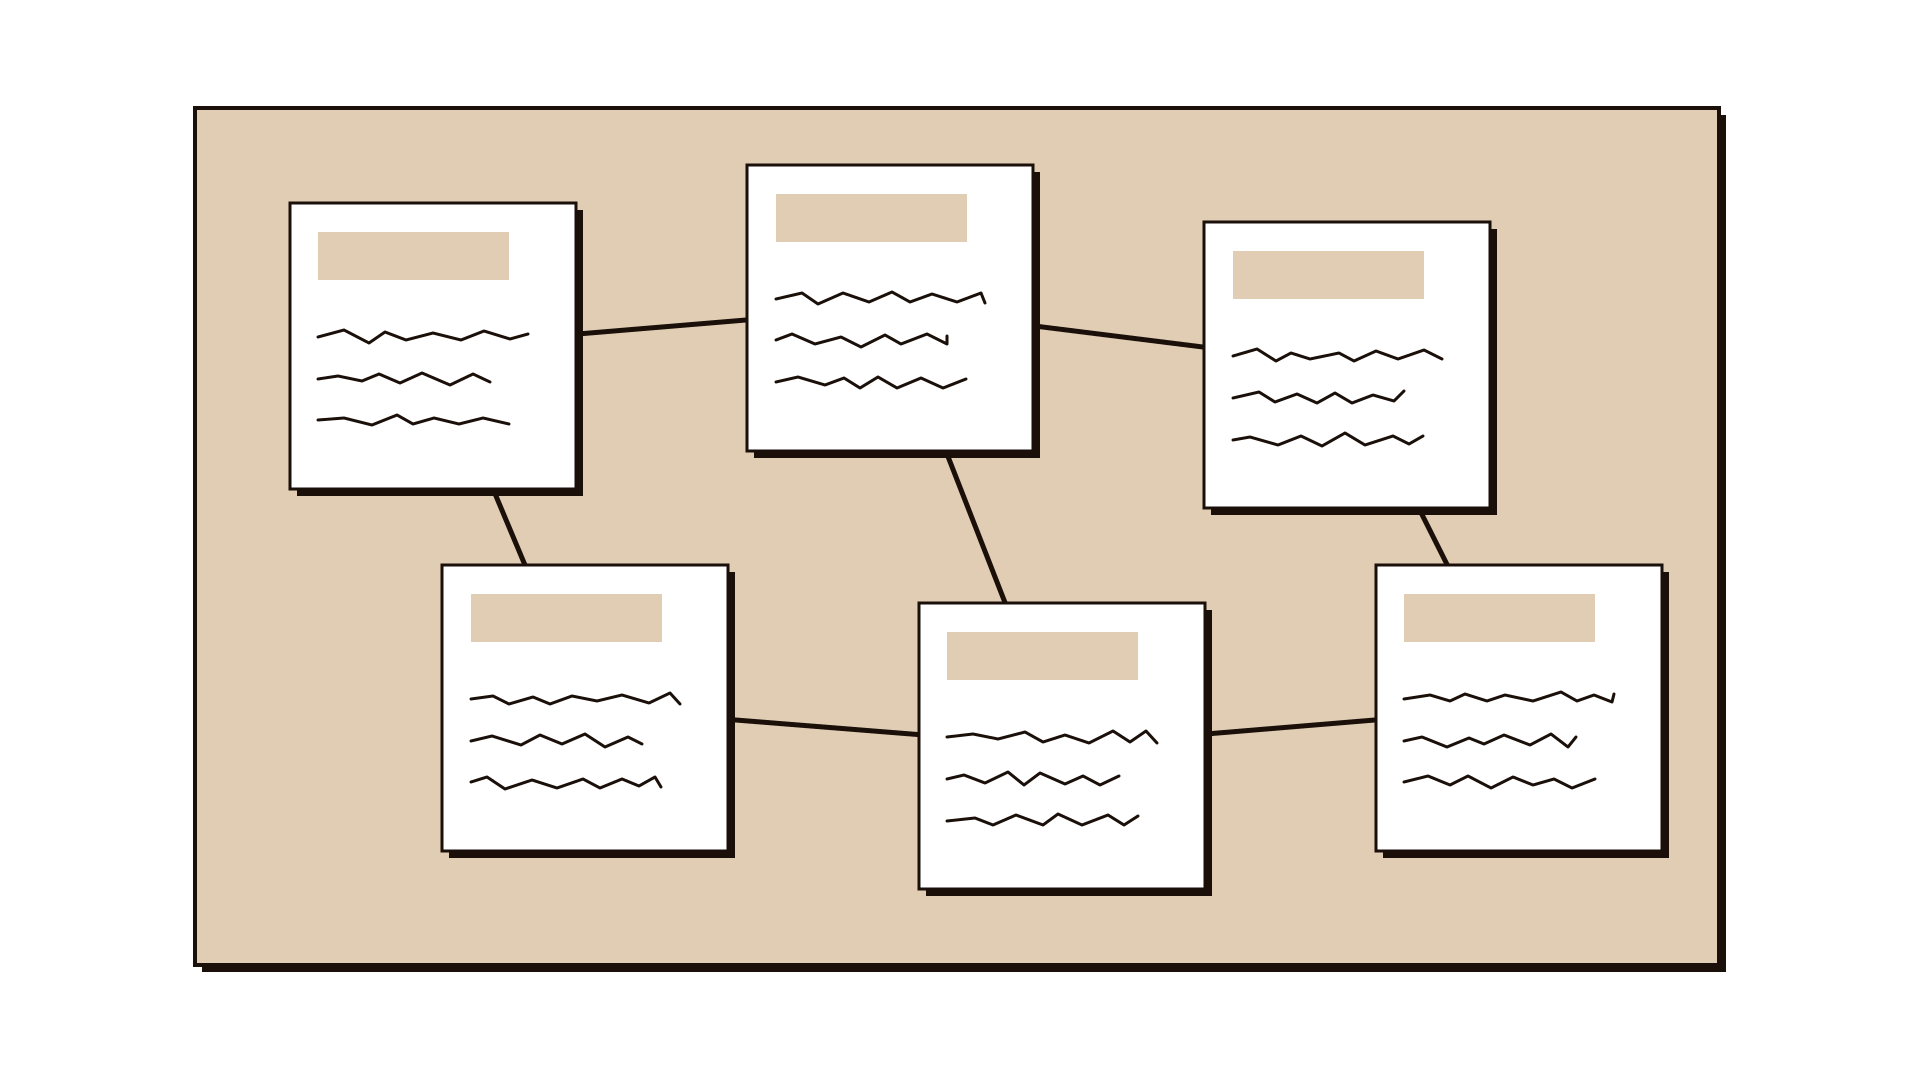
For each pair of actors that deal with each other, draw a line and write two short labels: what flows one way and what flows back. Value can be money, data, referrals, customers, permissions, advice, reputation or trust. A line with value flowing only one way is worth a closer look.
Step 4: Find the gaps and overlaps
Mark places where the people at the outcome need something nobody provides, where three actors offer the same thing, and where an actor in the middle takes value without adding much. Circle actors who hold a lot of lines; they are often the ones that can make or block a change.
Step 5: Check it with the actors
Before you rely on the map, test the value lines with one or two of the organisations on it. Ask them what they really get from the relationship. Their answers often differ from what the room assumed, and that difference is itself a finding.
Step 6: Mark the partners for scale
If you are spreading a solution, mark which actors already reach the people you need, which hold a permission or data you depend on, and what each would gain from taking part. Write that gain plainly next to each one; a partner with nothing to gain will not stay.
Step 7: Record and assign
Agree two or three moves the map suggests, such as a partnership to open, an overlap to resolve or a gap to fill, and name who will take each forward. Date the map; ecosystems change quickly, so plan to review it every six to twelve months.
Worked example
A municipality had piloted a fast licence for home-based food businesses in two districts and cut the average time to licence from 41 to 12 days. It now wanted the scheme to reach all 14 districts, but about 2,300 home food sellers were trading on social media and delivery apps with no licence at all.
Six people met for an hour: the licensing manager, a food safety inspector, the small business support lead from the municipality, a programme officer from a regional development fund, a partnerships manager from a delivery app and an officer from a women's community association.
They wrote the outcome "more home food businesses become licensed and stay open" and placed 21 actors around it, from the food authority and the civil defence directorate to private service offices, banks, packaging suppliers and three training providers.
The value lines showed that private service offices charged applicants a fee to file the paperwork, while the municipality's own free guidance reached almost nobody. Sellers paid for help the system already offered.
Three actors, the development fund and two training providers, ran nearly identical food hygiene courses, yet none of them counted towards the licence.
The delivery app held the most lines on the map. It already reached most of the unlicensed sellers, and its manager said a licence badge on listings would help it with its own food safety commitments.
The group agreed three moves: a pilot with the delivery app to show the licence route inside its seller sign-up, recognition of one shared hygiene course, and a conversation with the service offices about a reduced, published fee. Each move had a named owner and a review date in three months.
IllustrativeTips and mistakes
Tips
- Write value as a verb on each side of the line, such as "gets customers" or "gives approval". It forces the group to be specific.
- Include the people the outcome is for as actors on the map, not only at the centre. They give and receive value too.
- Look for the actor nobody in the room thought of. Informal intermediaries often hold more of the ecosystem than official ones.
- Keep a version of the map without names of organisations if you plan to share it outside the team.
Common mistakes
- Putting your own organisation at the centre instead of the shared outcome, which hides the actors who matter most.
- Drawing lines without labels, so the map shows connections but not why they exist.
- Treating the map as fact before checking the value lines with the organisations on it.
- Mixing in the detail of one service, which turns the ecosystem map into a crowded system map.
What you walk away with
You leave with a dated ecosystem map showing the shared outcome, the actors by type, the value each one gives and gets, the gaps and overlaps, and the partners you need to scale, plus two or three agreed moves with owners. A natural next step is a value case for scaling, or stakeholder interviews with the partners you marked.
Questions people ask
What is the difference between an ecosystem map and a system map?
A system map shows one service from the inside, around one person, and the flows that make it work or fail. An ecosystem map shows many organisations around a shared outcome and the value they exchange. Use the system map to fix a service and the ecosystem map to plan partnerships and scale.
What is the difference between an ecosystem map and a stakeholder map?
A stakeholder map places people and groups by how much they are affected and how much influence they have, to decide how to engage them. An ecosystem map is about exchange: what each organisation gives and gets. The same organisation can appear on both, for different reasons.
How big should an ecosystem map be?
For a first version, 15 to 30 actors usually covers a field well enough to act on. If the map grows much larger, group similar actors, such as "training providers", into one note and open them up only where the detail matters.
Tool card
The worksheet your team fills in, one box per field.
- Shared outcome
- Actors by type
- What each gives
- What each gets
- Gaps and overlaps
- Partners for scale