
Measuring transformation by outcomes, not activity
How to measure a transformation programme by what changes for customers and staff, not by milestones hit, systems launched or people trained.

Measuring transformation by outcomes, not activity
Measure a transformation by what is different for the people it was meant to serve: how long a customer waits, how often they have to chase, how much rework staff no longer do. Milestones hit, systems launched and people trained tell you the programme is busy, not that it is working. The fix is to write the outcome first, draw the chain from activity to that outcome, and report adoption and outcome measures ahead of anything else.
This piece is the measurement step of the hub pillar, transformation fails at the customer's door. If your problem is innovation measures more broadly, see how to measure innovation.
Why activity measures take over
Activity is easy to count, arrives on time and is almost always green. A programme office can report "new platform live, 86 per cent of milestones complete, 2,000 staff trained" every month without anyone checking whether customers noticed.
Three things push programmes this way:
- Outcomes arrive late. A new claims process may take a year to show in complaint rates. Milestones show every week.
- Outcomes are shared. No single workstream owns "customers call us less". Each one owns its own deliverable, so each reports its own deliverable.
- Outcomes can go red. A status report built on activity protects everyone. One built on outcomes exposes the programme while there is still time to change it, which is exactly why it is worth having.
The result is the familiar report: green on the outside, red on the inside. The programme closes on schedule, and the front line still works the old way, with a new system bolted on top. The sibling piece on why transformation programmes produce reports and nobody changes covers the wider pattern; this one is about the measures.
Seven steps to outcome measures
1. Write the outcome in the customer's words
Before any metric, write one sentence per outcome: who, what is different for them, and by when. "Small business owners get a trading licence in one visit, without being asked for the same document twice, by the end of next year." If you cannot write that sentence, no dashboard will tell you what the transformation is for.
Use a current-state experience map to find the moments that matter. The outcome should name one of them, not an abstraction like "improved customer experience".
2. Draw the chain from activity to outcome
Lay out four levels and be honest about which ones you currently measure:
| Level | Question | Example |
|---|---|---|
| Activity | What did we do? | Training sessions held; system configured |
| Output | What did we deliver? | New portal live; process documented |
| Adoption | Are people working the new way? | Share of applications started on the portal and finished there |
| Outcome | Is anything better for the people served? | Days from application to licence; repeat visits per application |
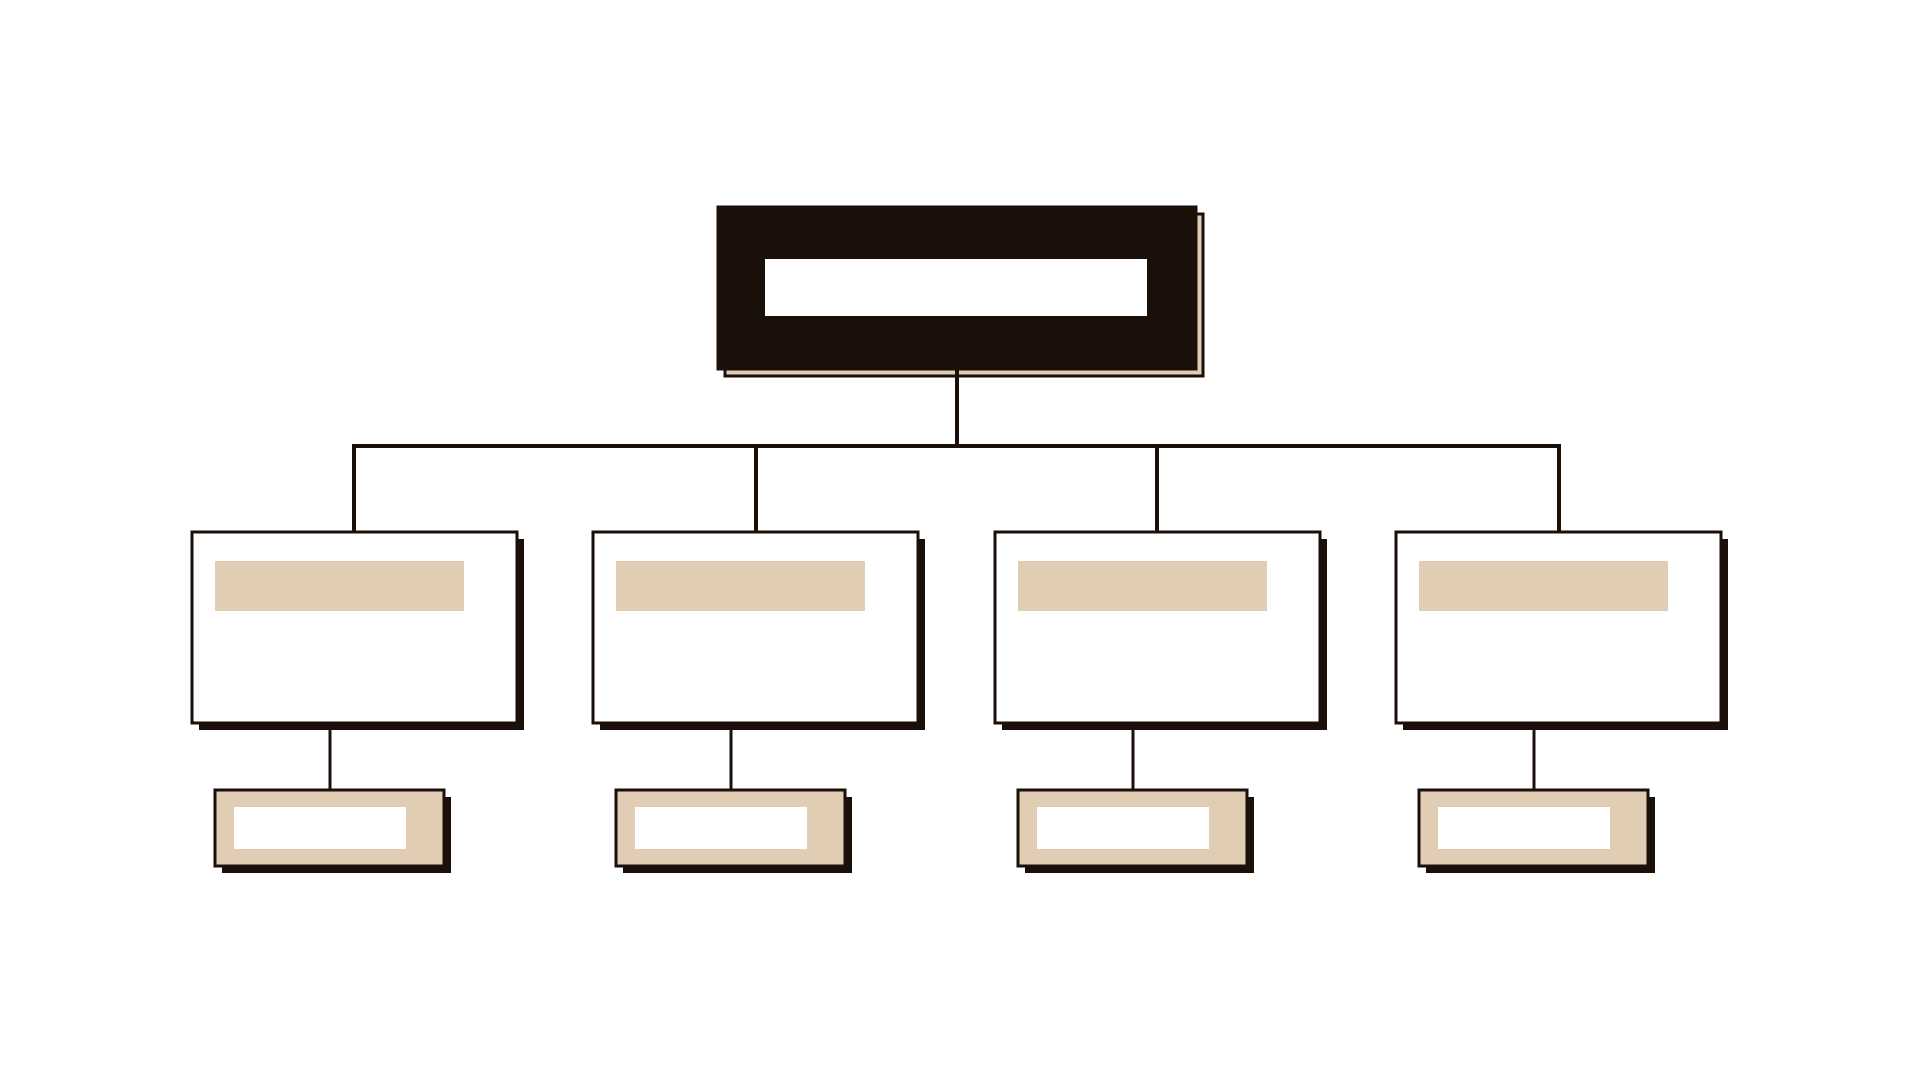
A KPI tree does this well: the outcome at the top, the drivers beneath it, and the activities only at the leaves. Activity and output measures belong in the project plan. Adoption and outcome measures belong in the report leaders read.
If the chain looks familiar, it should. Donald Kirkpatrick's model for evaluating training made the same move decades ago, separating whether people liked the course from whether their behaviour and results changed. Transformation programmes mostly stop at the first level.
3. Measure adoption separately, and look for the old route
Adoption is the level most programmes skip, and it is where most of them fail. A new process can be live and unused. Measure it directly:
- What share of the work goes through the new route end to end?
- How much still runs through the old route, in parallel? Count the spreadsheets, the shadow forms, the phone calls that bypass the system.
- How many workarounds have appeared? Workarounds are data: each one marks a place the new design does not fit the work.
Numbers will not show all of this. Spend half a day in contextual observation at the front line each month. Watching someone re-key a case from the new system into the old one beats any usage chart.
4. Take a baseline before anything changes
You cannot claim an improvement you did not measure before. Record each outcome and adoption measure for at least a few weeks before go-live, using the same definition you will use afterwards. If the data does not exist, sample it by hand: pull fifty cases and time them.
Write the definition down. "Days to licence" needs a start (application submitted, or first contact?) and an end (licence issued, or licence received?).
5. Decide in advance what result would change the plan
Treat each major change as a hypothesis: "If we move applications online with pre-filled data, repeat visits will fall within three months." Set the threshold and the decision date before launch, as you would with a hypothesis test. If the threshold is missed, the programme has agreed in advance to stop, adjust or redesign, not to extend the communication campaign.
6. Report outcomes first and keep red visible
Put outcomes at the top of the page, adoption next, and activity last, in a single line if it appears at all. Show each outcome against its baseline and its threshold. Where a measure is red, say what the programme is doing about it.
If your organisation already runs objectives and key results or a scorecard, put the transformation outcomes inside that system as key results rather than in a separate programme dashboard.
7. Review on a rhythm, and watch for gaming
Review outcome measures monthly with the people who own the work. Once a quarter, run a retrospective on the measures themselves: which ones changed a decision, which ones nobody looked at, and which ones people have started to manage instead of the work.
Goodhart's law, named after the economist Charles Goodhart, is the warning here: a measure put under pressure stops telling the truth. If "average handling time" becomes a target, calls get shorter and customers call back. Pair each target with a measure that would catch the shortcut, such as repeat contacts alongside handling time.
An example
Illustrative. A mid-sized insurer in the Netherlands ran a two-year programme to move claims handling onto a new platform. The monthly report showed milestones on track, the platform live in every region and every claims handler trained. Complaints were not falling.
The new programme director rebuilt the report around one outcome: "A customer with a simple home claim is paid without having to call us." Under it sat three measures: days from first notice to payment for simple claims; share of simple claims where the customer made a second contact; and share of claims handled entirely in the new platform without being re-keyed into the old one.
The baseline was uncomfortable. Many claims were still being copied into the old system because the finance team's payment step had not moved. Handlers had built a shared spreadsheet to track what the platform could not. Second contacts had not changed since go-live.
The next quarter's work was redirected to the payment handover, which no workstream had owned. Activity measures left the board report.
Do's and don'ts
Do
- Write each outcome as a sentence the customer would recognise.
- Measure adoption on its own, including how much work still runs through the old route.
- Baseline before go-live, with definitions written down.
- Set thresholds and decision dates before launch.
- Pair every target with a measure that would expose gaming.
Don't
- Don't report "per cent of milestones complete" as evidence of progress.
- Don't count people trained as a result; count people working the new way.
- Don't treat go-live as the finish line. For the customer, it is the start.
- Don't let each workstream report only its own deliverable; someone must own the shared outcome.
- Don't rank teams or individuals by adoption numbers. It teaches people to hide workarounds, which are the most useful signal you have.
Questions people ask
What are good KPIs for a digital transformation? Start with two or three outcome measures tied to a moment customers or staff feel, such as time to resolution, repeat contacts or rework. Add one or two adoption measures, such as the share of work completed end to end in the new route. System uptime and features delivered belong to the project plan, not the transformation scorecard. The sibling piece digital transformation is a service design problem explains why.
What is the difference between an output and an outcome? An output is what the programme delivers: a portal, a process, a training course. An outcome is what changes for the people the programme serves because of it: fewer visits, faster decisions, less rework.
How soon can you measure the results of a transformation? Adoption shows within weeks of go-live and is the best early signal. Outcomes usually take a few months to settle, which is why you set thresholds and decision dates in advance and watch adoption in the meantime. If adoption is low at week six, the outcomes will not arrive on their own.
Close
To build your measures, start with an experience map to find the moments that matter, draw the chain with a KPI tree, and frame each major change as a hypothesis test. For keeping teams in charge of the plan those measures steer, read running a transformation roadmap that teams own. All method guides are in the guides index.